Ceramic Membrane Market Size, Share & Trends
Ceramic Membrane Market Size, Share & Trends Analysis Report By Technology (Ultrafiltration, Microfiltration, Nanofiltration, Others), By Application (Water & Wastewater Treatment, Industry Processing), By Region, And Segment Forecasts, 2025 - 2030
Published Date: May - 2025 | Publisher: MIR | No of Pages: 220 | Industry: Chemical & Material Research | Format: Report available in PDF / Excel Format
View Details Buy Now 1500 Download Free Sample Ask for Discount Request CustomizationCeramic Membrane Market Summary
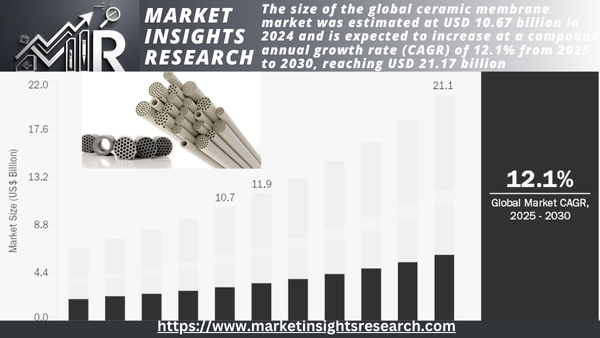
The size of the global ceramic membrane market was estimated at USD 10.67 billion in 2024 and is expected to increase at a compound annual growth rate (CAGR) of 12.1% from 2025 to 2030, reaching USD 21.17 billion. This expansion is explained by the growing use of ceramic membranes in several sectors, including biotechnology, water and waste management, chemicals, pharmaceuticals, and food and beverage.
Download Free Sample Ask for Discount Request Customization
Market Size & Trends
- The Asia Pacific ceramic membrane market held the largest market share of 37.6% in 2024.
- The China ceramic membrane industry held a substantial market share in 2024.
- By technology, the microfiltration technology accounted for a significant market revenue share of 29.7% in 2024.
- By application, the water & wastewater treatment segment will dominate the market in 2024.
Key Market Statistics
- 2024 Market Size$10.67 Billion
- 2030 Estimated Market Size$21.17 Billion
- CAGR12.1% (2025-2030)
- Asia PacificLargest market in 2024 and fastest growing region during the forecast period
This expansion is explained by the growing use of ceramic membranes in several sectors, including biotechnology, water and waste management, chemicals, pharmaceuticals, and food and beverage. This product has many qualities, including durability and abrasion resistance. Additionally, the product exhibits mechanical, chemical, and thermal stability. It is the perfect product for filtering in the aforementioned industries because of these qualities.
Since clean water is a limited and vital resource, efficient filtration is becoming more and more crucial as the world's water demand increases as a result of population expansion. Ceramic membranes provide many advantages, including long service life, low maintenance requirements, great durability, and resistance to heat and chemicals. By incorporating ceramic membranes into filtering systems, we can improve water management and ensure long-term sustainability.
The goals of ceramic membrane research and development are to lower production costs, increase product performance, and broaden its use. Furthermore, fabrication methods have a significant impact on the product's overall performance. For example, several techniques, including extrusion, slip casting, and tape casting, aid in the creation of ceramic membranes with controlled porosity and thickness.
Suppliers of raw materials, manufacturers, distributors/suppliers, and end users make up the ceramic membrane market's value chain. There are several raw material providers in the market that give producers ingredients, including coatings, binders, additives, and ceramic powders. After manufacturing the product, producers either distribute it directly to end customers or through third-party distributors.
Market Concentration & Characteristics
The market is expanding at a rapid rate and is in a high-growth stage. The ceramic membrane industry is very innovative because of fast improvements in materials science, manufacturing methods, and uses, leading to better membrane strength, more effective filtration, the ability to withstand tough conditions, and the use of nanotechnology for better performance in water treatment and industrial processes. With its cutting-edge ceramic membrane technology, IPNR Endura provides remarkable resilience to adverse environments and longevity. These membranes are perfect for high-purity applications since they can filter out particles as small as 0.1 micrometers.
There is a moderate amount of merger and acquisition (M&A) activity among the major competitors in the ceramic membrane market. Larger businesses are looking to enter new markets, improve their market positions, or diversify their technology portfolios. In sectors including water treatment, food & beverage, and pharmaceuticals, strategic acquisitions frequently aim to get exclusive technologies, manufacturing skills, or access to existing clientele.
Additionally, the ceramic membrane sector is coming under more and more regulatory scrutiny. Industry adoption of more dependable and durable filtration technology is being driven by strict environmental and water quality standards. By promoting innovation and compliance and displacing less robust options, these restrictions are accelerating market expansion.
Alternatives to ceramic membranes have a reasonable level of power. Although metal and polymeric membranes are readily accessible and frequently less expensive, ceramic membranes typically offer greater durability and chemical resistance. Ceramics
Report Coverage & Deliverables
The PDF report & online dashboard will help you understand
- Competitive benchmarking
- Historical data & forecasts
- Company revenue shares
- Regional opportunities
- Latest trends & dynamics
Technology Insights
Ultrafiltration, microfiltration, nanofiltration, and others divide the market. In 2024, microfiltration technology accounted for a noteworthy 29.7% of global revenue share. Its pore size falls generally between 0.1 µm and 5 µm, and its membranes have open-pore architectures. Clarification—that is, the removal of suspended materials to provide a clear liquid—is the typical use for ceramic microfiltration membranes. Made from inorganic elements, ceramic membranes are becoming rather popular as they have better running temperatures and durability than those produced from organic materials.
Over the projection period, ultrafiltration technology is expected to develop at the quickest CAGR. Ultrafiltration is an effective barrier against dangerous bacteria, viruses, and other pollutants; it is a single-membrane filtration method with pore sizes between 0.01 µm and 0.1 µm. This segment's development can be ascribed to its better mechanical thermal stability, mechanical strength, and chemical resistance than other alternatives, such as polymeric membranes.
Application Insights
In 2024, the category with water and wastewater treatments controlled most of the market. The rising industry, urbanization, and fast-growing world population are significantly stressing current freshwater resources, which is why there is a high demand for ceramic membranes. Furthermore, certain rules and demands that governments of nations follow concerning water treatment and disposal are expected to stimulate product development to protect the environment.
We expect the pharmaceutical and medical category to expand at the fastest CAGR over the next years. Nanofiltration from ceramic membranes eliminates drug residues from wastewater. By ultrafiltration/nanofiltration, they allow solvent filtration, germ/virus retention, and oil-water separation. Because of their outstanding chemical resistance, they work well in filtering acids and caustics as well as in dye separation. While a finer membrane with a 0.2 μm pore size is used to sterilize liquid pharmaceuticals by filtering out germs and other microscopic organisms, a microfiltration membrane with a 0.45 micrometer (μm) hole size is usually used to clean liquids and water by removing big particles.
Download Free Sample Ask for Discount Request Customization
Regional Insights
North America's ceramic membrane market share is projected to grow at a significant CAGR from 2025 to 2030. The North American ceramic membrane market is anticipated to experience rapid growth on account of rapid adoption of the technology for its utilization in application industries. National Primary Drinking Water Regulations (NPDWR) set legally enforceable standards for over 90 contaminants, including microorganisms, disinfectants, and inorganic chemicals, to ensure the safety of public water systems. These regulations require water systems to employ the best available technologies to meet contaminant limits and adhere to rigorous testing and monitoring protocols. In addition, the growing oil & gas industry and increasing product demand from power generation industries in countries such as the U.S. and Canada are expected to promote water filtration activities, thus driving the growth of the ceramic membrane market.
U.S. Ceramic Membrane Market Trends
The U.S. dominated the North American pore strip industry in 2024, owing to rising economic revival and government initiatives to promote environmentaln, which are expected to drive the ceramic membrane market in the U.S. Increasing pressure on the oil & gas industry to minimize pollutants in the released water is expected to boost the application of ceramic membranes, thereby fueling the market growth.
Europe Ceramic Membrane Market Trends
The ceramic membrane market in Europe has been witnessing continuous growth recently. Stringent environmental regulations and sustainability goals are driving industries to adopt cleaner and more efficient filtration technologies. Ceramic membranes offer superior chemical & thermal stability, making them ideal for harsh industrial applications such as wastewater treatment, food & beverage processing, and pharmaceuticals.
Asia Pacific Ceramic Membrane Market Trends
In 2024, the Asia Pacific ceramic membrane market held the largest market share, at 37.6%. Rapid industrialization and urbanization are increasing the demand for clean water and efficient water management systems, with ceramic membranes playing a vital role in addressing these challenges and driving the need for more efficient and sustainable water treatment solutions. Ceramic membranes offer a durable, low-maintenance option ideal for regions facing infrastructure challenges and harsh water conditions. As a result, investment in ceramic membrane technology is gaining momentum across Asia to mitigate long-term economic and environmental costs.
The China ceramic membrane industry held a substantial market share in 2024. In Zhejiang, only 29% of small towns have access to safe water, and only 26% have wastewater treatment services. The lack of proper sanitation infrastructure is pushing local governments to invest in advanced water treatment solutions. Ceramic membranes, known for their durability and efficiency, are well-suited for treating polluted and complex wastewater in both urban and rural areas. Simultaneously, health-conscious consumers are driving growth in China's bottled water, cleansing juices, and nutritional drinks, further boosting demand for reliable membrane technologies.
Download Free Sample Ask for Discount Request Customization
Key Ceramic Membrane Company Insights
Some of the key companies in the ceramic membrane industry include GEA Group Aktiengesellschaft, Pall Corporation, and others. Key players are taking several strategic initiatives, such as mergers and acquisitions and partnerships with other major companies.
-
CeraFiltec GmbH specializes in ceramic membrane filtration systems. At Aquatech Amsterdam 2025, the company showcased its latest ceramic membrane technology. The innovations focus on energy efficiency, durability, and high filtration performance. Their products serve applications like desalination, wastewater reuse, and potable water treatment. CeraFiltec emphasizes sustainable and advanced water treatment solutions.
-
Nanostone Water, Inc. specializes in advanced ceramic ultrafiltration membrane systems. Headquartered in Massachusetts, it serves municipal and industrial water treatment markets. The company focuses on improving water quality, efficiency, and sustainability. Its membranes are used in surface water, seawater, and industrial reuse applications. Nanostone actively engages in industry events to showcase its innovations.
Key Ceramic Membrane Companies
The following are the leading companies in the ceramic membrane market. These companies collectively hold the largest market share and dictate industry trends.
- GEA Group Aktiengesellschaft
- Pall Corporation
- Hyflux Ltd
- Kovalus Separation Solutions
- Nanostone
- Veolia
- TAMI Industries
- METAWATER Co., Ltd.
- ITN Nanovation AG
- SIVA Unit
Ceramic Membrane Market Report Scope
Report Attribute |
Details |
Market size value in 2025 |
USD 11.93 billion |
Revenue forecast in 2030 |
USD 21.17 billion |
Growth rate |
CAGR of 12.1% from 2025 to 2030 |
Base year for estimation |
2024 |
Historical data |
2018-2023 |
Forecast period |
2025-2030 |
Report updated |
May 2025 |
Quantitative units |
Revenue in USD million and CAGR from 2025 to 2030 |
Report coverage |
Revenue forecast, company ranking, competitive landscape, growth factors, and trends |
Segments covered |
Technology, Application and Region |
Regional scope |
North America; Europe; Asia Pacific; Latin America; Middle East & Africa |
Country scope |
U.S.; Canada; Mexico; UK; Germany; France; Italy; Spain; China; India; Japan; South Korea; Brazil; Argentina |
Key companies profiled |
GEA Group Aktiengesellschaft; Pall Corporation; Hyflux Limited; Kovalus Separation Solutions; Nanostone; Veolia; TAMI Industries; METAWATER CO., LTD.; ITN Nanovation AG; SIVA Unit |
Customization scope |
We offer free report customization, equivalent to up to 8 analysts' working days, with every purchase. Changes or additions to the scope of the country, region, and segment are possible. |
Pricing and purchase options |
Avail yourself of customized purchase options to meet your exact research needs. Explore purchase options |
Global Ceramic Membrane Market Report Segmentation
This report forecasts revenue growth at global, regional, and country levels and provides an analysis of the latest industry trends in each of the sub-segments from 2018 to 2030. For this study, Grand View Research has segmented the global ceramic membrane market report based on technology, application, and region.
-
Technology Outlook (Revenue, USD Million, 2018-2030)
-
Ultrafiltration
-
Microfiltration
-
Nanofiltration
-
Others
-
-
Application Outlook (Revenue, USD Million, 2018-2030)
-
Water & Wastewater Treatment
-
Industry Processing
-
Food & Beverage Processing
-
Pharmaceutical & Medical
-
Others
-
-
Regional Outlook (Revenue, USD Million, 2018-2030)
-
North America
-
U.S.
-
Canada
-
Mexico
-
-
Europe
-
Germany
-
UK
-
France
-
Italy
-
Spain
-
-
Asia Pacific
-
China
-
Japan
-
India
-
South Korea
-
-
Latin America
-
Brazil
-
Argentina
-
-
Middle East and Africa
-
Related Reports
- Dimethyl Terephthalate Market - By Form (Solid, Liquid), Grade (Technical, Reagent, Pure, Synthesis), Application, End u...
- Bromine Derivatives Market - By Derivative Type (Organobromines, Clear Brine Fluids, Hydrogen Bromide, Brominated Flame ...
- Butylated Hydroxytoluene (BHT) Market - By Application (Food, Animal Feed, Lubricating & Specialty Oils, Rubber, Persona...
- Nano Coating Market - By Type (Anti-Fingerprint Coatings, Anti-Microbial Coatings, Self-Cleaning Coatings, Anti-Corrosio...
- Anti-corrosion Coatings Market - By Product (Epoxy, Polyurethane, Acrylic, Alkyd, Zinc, Chlorinated Rubber), By Mode of ...
Table of Content
Chapter 1. Methodology and Scope
1.1. Market Segmentation & Scope
1.2. Market Definition
1.3. Information Procurement
1.3.1. Purchased Database
1.3.2. GVR’s Internal Database
1.3.3. Secondary Sources & Third-Party Perspectives
1.3.4. Primary Research
1.4. Information Analysis
1.4.1. Data Analysis Models
1.5. Market Formulation & Data Visualization
1.6. Data Validation & Publishing
Chapter 2. Executive Summary
2.1. Market Snapshot
2.2. Segment Snapshot
2.3. Competitive Landscape Snapshot
Chapter 3. Ceramic Membrane Market Variables, Trends & Scope
3.1. Market Lineage Outlook
3.1.1. Parent Market Outlook
3.1.2. Related Market Outlook
3.2. Industry Value Chain Analysis
3.3. Regulatory Framework (regulations given)
3.4. Market Dynamics
3.4.1. Market Driver Analysis
3.4.2. Market Restraint Analysis
3.4.3. Industry Challenges
3.4.4. Industry Opportunities
3.5. Industry Analysis Tools
3.5.1. Porter’s Five Forces Analysis
3.5.2. Macro-environmental Analysis
Chapter 4. Ceramic Membrane Market: Technology Estimates & Trend Analysis
4.1. Segment Dashboard
4.2. Ceramic Membrane Market: Technology Movement Analysis & Market Share, 2024 & 2030
4.3. Microfiltration
4.3.1. Microfiltration Market Revenue Estimates and Forecasts, 2018 - 2030 (USD Million)
4.4. Ultrafiltration
4.4.1. Ultrafiltration Market Revenue Estimates and Forecasts, 2018 - 2030 (USD Million)
4.5. Nanofiltration
4.5.1. Nanofiltration Market Revenue Estimates and Forecasts, 2018 - 2030 (USD Million)
4.6. Others
4.6.1. Others Market Revenue Estimates and Forecasts, 2018 - 2030 (USD Million)
Chapter 5. Ceramic Membrane Market: Application Estimates & Trend Analysis
5.1. Segment Dashboard
5.2. Ceramic Membrane Market: Application Movement Analysis & Market Share, 2024 & 2030
5.3. Water & Wastewater Treatment
5.3.1. Water & Wastewater Treatment Market Revenue Estimates and Forecasts, 2018 - 2030 (USD Million)
5.4. Industry Processing
5.4.1. Industry Processing Market Revenue Estimates and Forecasts, 2018 - 2030 (USD Million)
5.5. Food & Beverages Processing
5.5.1. Food & Beverages Processing Market Revenue Estimates and Forecasts, 2018 - 2030 (USD Million)
5.6. Pharmaceutical & Medical
5.6.1. Pharmaceutical & Medical Market Revenue Estimates and Forecasts, 2018 - 2030 (USD Million)
5.7. Others
5.7.1. Others Market Revenue Estimates and Forecasts, 2018 - 2030 (USD Million)
Chapter 6. Ceramic membrane Market: Regional Estimates & Trend Analysis
6.1. Regional Movement Analysis & Market Share, 2024 & 2030
6.2. North America
6.2.1. North America Chemical Market Estimates & Forecast, 2018 - 2030 (USD Million)
6.2.2. U.S.
6.2.2.1. Key country dynamics
6.2.2.2. U.S. ceramic membrane market estimates & forecast, 2018 - 2030 (USD Million)
6.2.3. Canada
6.2.3.1. Key country dynamics
6.2.3.2. Canada ceramic membrane market estimates & forecast, 2018 - 2030 (USD Million)
6.2.4. Mexico
6.2.4.1. Key country dynamics
6.2.4.2. Mexico ceramic membrane market estimates & forecast, 2018 - 2030 (USD Million)
6.3. Europe
6.3.1. Europe Chemical Market Estimates & Forecast, 2018 - 2030 (USD Million)
6.3.2. Germany
6.3.2.1. Key country dynamics
6.3.2.2. Germany ceramic membrane market estimates & forecast, 2018 - 2030 (USD Million)
6.3.3. UK
6.3.3.1. Key country dynamics
6.3.3.2. UK ceramic membrane market estimates & forecast, 2018 - 2030 (USD Million)
6.3.4. France
6.3.4.1. Key country dynamics
6.3.4.2. France ceramic membrane market estimates & forecast, 2018 - 2030 (USD Million)
6.3.5. Italy
6.3.5.1. Key country dynamics
6.3.5.2. Italy ceramic membrane market estimates & forecast, 2018 - 2030 (USD Million)
6.3.6. Spain
6.3.6.1. Key country dynamics
6.3.6.2. Spain ceramic membrane market estimates & forecast, 2018 - 2030 (USD Million)
6.4. Asia Pacific
6.4.1. Asia Pacific Chemical Market Estimates & Forecast, 2018 - 2030 (USD Million)
6.4.2. China
6.4.2.1. Key country dynamics
6.4.2.2. China ceramic membrane market estimates & forecast, 2018 - 2030 (USD Million)
6.4.3. Japan
6.4.3.1. Key country dynamics
6.4.3.2. Japan ceramic membrane market estimates & forecast, 2018 - 2030 (USD Million)
6.4.4. India
6.4.4.1. Key country dynamics
6.4.4.2. India ceramic membrane market estimates & forecast, 2018 - 2030 (USD Million)
6.4.5. South Korea
6.4.5.1. Key country dynamics
6.4.5.2. South Korea ceramic membrane market estimates & forecast, 2018 - 2030 (USD Million)
6.5. Latin America
6.5.1. Latin America Chemical Market Estimates & Forecast, 2018 - 2030 (USD Million)
6.5.2. Brazil
6.5.2.1. Key country dynamics
6.5.2.2. Brazil ceramic membrane market estimates & forecast, 2018 - 2030 (USD Million)
6.5.3. Argentina
6.5.3.1. Key country dynamics
6.5.3.2. Argentina ceramic membrane market estimates & forecast, 2018 - 2030 (USD Million)
6.6. Middle East & Africa
6.6.1. Middles East & Africa Chemical Market Estimates & Forecast, 2018 - 2030 (USD Million)
Chapter 7. Ceramic membrane Market - Competitive Landscape
7.1. Recent Developments & Impact Analysis, By Key Market Participants
7.2. Company Categorization
7.3. Company Heat Map
7.4. Position Analysis, 2024
7.5. Strategy Mapping
7.5.1. Expansion
7.5.2. Mergers & Acquisition
7.5.3. Partnerships & Collaborations
7.5.4. New Product Launches
7.5.5. Research and Development
7.6. Company Profiles
7.6.1. GEA Group Aktiengesellschaft
7.6.1.1. Participant’s overview
7.6.1.2. Financial performance
7.6.1.3. Product benchmarking
7.6.1.4. Recent developments
7.6.2. Pall Corporation
7.6.2.1. Participant’s overview
7.6.2.2. Financial performance
7.6.2.3. Product benchmarking
7.6.2.4. Recent developments
7.6.3. Hyflux Ltd
7.6.3.1. Participant’s overview
7.6.3.2. Financial performance
7.6.3.3. Product benchmarking
7.6.3.4. Recent developments
7.6.4. Kovalus Separation Solutions
7.6.4.1. Participant’s overview
7.6.4.2. Financial performance
7.6.4.3. Product benchmarking
7.6.4.4. Recent developments
7.6.5. Nanostone
7.6.5.1. Participant’s overview
7.6.5.2. Financial performance
7.6.5.3. Product benchmarking
7.6.5.4. Recent developments
7.6.6. Veolia
7.6.6.1. Participant’s overview
7.6.6.2. Financial performance
7.6.6.3. Product benchmarking
7.6.6.4. Recent developments
7.6.7. TAMI Industries
7.6.7.1. Participant’s overview
7.6.7.2. Financial performance
7.6.7.3. Product benchmarking
7.6.7.4. Recent developments
7.6.8. METAWATER Co., Ltd.
7.6.8.1. Participant’s overview
7.6.8.2. Financial performance
7.6.8.3. Product benchmarking
7.6.8.4. Recent developments
7.6.9. ITN Nanovation AG
7.6.9.1. Participant’s overview
7.6.9.2. Financial performance
7.6.9.3. Product benchmarking
7.6.9.4. Recent developments
7.6.10. SIVA Unit
7.6.10.1. Participant’s overview
7.6.10.2. Financial performance
7.6.10.3. Product benchmarking
7.6.10.4. Recent developments
List of Tables
Table 1 List of abbreviation
Table 2 Ceramic membrane market 2018 - 2030 (USD Million)
Table 3 Global market estimates and forecasts by region, 2018 - 2030
Table 4 Global market estimates and forecasts by region, 2018 - 2030 (USD Million)
Table 5 Global market estimates and forecasts by technology, 2018 - 2030
Table 6 Global market estimates and forecasts by technology, 2018 - 2030 (USD Million)
Table 7 Global market estimates and forecasts by application, 2018 - 2030
Table 8 Global market estimates and forecasts by application, 2018 - 2030 (USD Million)
Table 9 Global market estimates and forecasts by region, 2018 - 2030
Table 10 Global market estimates and forecasts by region, 2018 - 2030 (USD Million)
Table 11 North America ceramic membrane market by technology, 2018 - 2030
Table 12 North America ceramic membrane market by application, 2018 - 2030 (USD Million)
Table 13 U.S. ceramic membrane market by technology, 2018 - 2030
Table 14 U.S. ceramic membrane market by application, 2018 - 2030 (USD Million)
Table 15 Canada ceramic membrane market by technology, 2018 - 2030
Table 16 Canada ceramic membrane market by application, 2018 - 2030 (USD Million)
Table 17 Mexico ceramic membrane market by technology, 2018 - 2030
Table 18 Mexico ceramic membrane market by application, 2018 - 2030 (USD Million)
Table 19 Europe ceramic membrane market by technology, 2018 - 2030
Table 20 Europe ceramic membrane market by application, 2018 - 2030 (USD Million)
Table 21 Germany ceramic membrane market by technology, 2018 - 2030
Table 22 Germany ceramic membrane market by application, 2018 - 2030 (USD Million)
Table 23 UK ceramic membrane market by technology, 2018 - 2030
Table 24 UK ceramic membrane market by application, 2018 - 2030 (USD Million)
Table 25 France ceramic membrane market by technology, 2018 - 2030
Table 26 France ceramic membrane market by application, 2018 - 2030 (USD Million)
Table 27 Italy ceramic membrane market by technology, 2018 - 2030
Table 28 Italy ceramic membrane market by application, 2018 - 2030 (USD Million)
Table 29 Spain ceramic membrane market by technology, 2018 - 2030
Table 30 Spain ceramic membrane market by application, 2018 - 2030 (USD Million)
Table 31 Asia Pacific ceramic membrane market by technology, 2018 - 2030
Table 32 Asia Pacific ceramic membrane market by application, 2018 - 2030 (USD Million)
Table 33 China ceramic membrane market by technology, 2018 - 2030
Table 34 China ceramic membrane market by application, 2018 - 2030 (USD Million)
Table 35 Japan ceramic membrane market by technology, 2018 - 2030
Table 36 Japan ceramic membrane market by application, 2018 - 2030 (USD Million)
Table 37 India ceramic membrane market by technology, 2018 - 2030
Table 38 India ceramic membrane market by application, 2018 - 2030 (USD Million)
Table 39 South Korea ceramic membrane market by technology, 2018 - 2030
Table 40 South Korea ceramic membrane market by application, 2018 - 2030 (USD Million)
Table 41 Australia ceramic membrane market by technology, 2018 - 2030
Table 42 Australia ceramic membrane market by application, 2018 - 2030 (USD Million)
Table 43 Latin America ceramic membrane market by technology, 2018 - 2030
Table 44 Latin America ceramic membrane market by application, 2018 - 2030 (USD Million)
Table 45 Middle East & Africa ceramic membrane market by technology, 2018 - 2030
Table 46 Middle East & Africa ceramic membrane market by application, 2018 - 2030 (USD Million)
List of Figures
Fig. 1 Market Research Process
Fig. 2 Data Triangulation Techniques
Fig. 3 Primary Research Pattern
Fig. 4 Market Research Approaches
Fig. 5 QFD Modeling for Market Share Assessment
Fig. 6 Information Procurement
Fig. 7 Market Formulation and Validation
Fig. 8 Data Validating & Publishing
Fig. 9 Market Segmentation & Scope
Fig. 10 Ceramic Membrane Market Snapshot
Fig. 11 Segment Snapshot (1/2)
Fig. 12 Segment Snapshot (1/2)
Fig. 13 Competitive Landscape Snapshot
Fig. 14 Parent Market Outlook
Fig. 15 Ceramic Membrane Market Value, 2024 (USD Million)
Fig. 16 Ceramic Membrane Market - Value Chain Analysis
Fig. 17 Ceramic Membrane Market - Market Dynamics
Fig. 18 Ceramic Membrane Market - PORTER’s Analysis
Fig. 19 Ceramic Membrane Market - PESTEL Analysis
Fig. 20 Ceramic Membrane Market Estimates & Forecasts, By Technology: Key Takeaways
Fig. 21 Ceramic Membrane Market Share, By Technology, 2024 & 2030
Fig. 22 Microfiltration Market Estimates & Forecasts, 2018 - 2030 (USD Million)
Fig. 23 Ultrafiltration Market Estimates & Forecasts, 2018 - 2030 (USD Million)
Fig. 24 Nanofiltration Market Estimates & Forecasts, 2018 - 2030 (USD Million)
Fig. 25 Other Technologies Market Estimates & Forecasts, 2018 - 2030 (USD Million)
Fig. 26 Ceramic membrane Market Estimates & Forecasts, By Application: Key Takeaways
Fig. 27 Ceramic membrane Market Share, By Application, 2024 & 2030
Fig. 28 Ceramic membrane Market Estimates & Forecasts, in Water & Wastewater Treatment, 2018 - 2030 (USD Million)
Fig. 29 Ceramic membrane Market Estimates & Forecasts, in Industry Processing, 2018- 2030, (USD Million)
Fig. 30 Ceramic membrane Market Estimates & Forecasts, in Food & Beverage Process, 2018 - 2030 (USD Million)
Fig. 31 Ceramic membrane Market Estimates & Forecasts, in Pharmaceutical & Medical, 2018 - 2030 (USD Million)
Fig. 32 Ceramic membrane Market Estimates & Forecasts, in Others, 2018 - 2030 (USD Million)
Fig. 33 Ceramic membrane Market Revenue, By Region, 2024 & 2030 (USD Million)
Fig. 34 North America Ceramic Membrane Market Estimates & Forecasts, 2018 - 2030 (USD Million)
Fig. 35 U.S. Ceramic membrane Market Estimates & Forecasts, 2018 - 2030 (USD Million)
Fig. 36 Canada Ceramic Membrane Market Estimates & Forecasts, 2018 - 2030 (USD Million)
Fig. 37 Mexico Ceramic Membrane Market Estimates & Forecasts, 2018 - 2030 (USD Million)
Fig. 38 Europe Ceramic Membrane Market Estimates & Forecasts, 2018 - 2030 (USD Million)
Fig. 39 Germany Ceramic Membrane Market Estimates & Forecasts, 2018 - 2030 (USD Million)
Fig. 40 UK Ceramic Membrane Market Estimates & Forecasts, 2018 - 2030 (USD Million)
Fig. 41 France Ceramic Membrane Market Estimates & Forecasts, 2018 - 2030 (USD Million)
Fig. 42 Italy Ceramic Membrane Market Estimates & Forecasts, 2018 - 2030 (USD Million)
Fig. 43 Spain Ceramic Membrane Market Estimates & Forecasts, 2018 - 2030 (USD Million)
Fig. 44 Asia Pacific Ceramic Membrane Market Estimates & Forecasts, 2018 - 2030 (USD Million)
Fig. 45 China Ceramic Membrane Market Estimates & Forecasts, 2018 - 2030 (USD Million)
Fig. 46 India Ceramic Membrane Market Estimates & Forecasts, 2018 - 2030 (USD Million)
Fig. 47 Japan Ceramic Membrane Market Estimates & Forecasts, 2018 - 2030 (USD Million)
Fig. 48 South Korea Ceramic Membrane Market Estimates & Forecasts, 2018 - 2030 (USD Million)
Fig. 49 Latin America Ceramic Membrane Market Estimates & Forecasts, 2018 - 2030 (USD Million)
Fig. 50 Brazil Ceramic Membrane Market Estimates & Forecasts, 2018 - 2030 (USD Million)
Fig. 51 Argentina Ceramic Membrane Market Estimates & Forecasts, 2018 - 2030 (USD Million)
Fig. 52 Middle East & Africa Ceramic Membrane Market Estimates & Forecasts, 2018 - 2030 (USD Million)
Fig. 53 Key Company Categorization
Fig. 54 Company Market Positioning
Fig. 55 Strategy Mapping
Key Ceramic Membrane Companies:
The following are the leading companies in the ceramic membrane market. These companies collectively hold the largest market share and dictate industry trends.
- GEA Group Aktiengesellschaft
- Pall Corporation
- Hyflux Ltd
- Kovalus Separation Solutions
- Nanostone
- Veolia
- TAMI Industries
- METAWATER Co., Ltd.
- ITN Nanovation AG
- SIVA Unit
FAQ'S
For a single, multi and corporate client license, the report will be available in PDF format. Sample report would be given you in excel format. For more questions please contact:
Within 24 to 48 hrs.
You can contact Sales team (sales@marketinsightsresearch.com) and they will direct you on email
You can order a report by selecting payment methods, which is bank wire or online payment through any Debit/Credit card, Razor pay or PayPal.
Discounts are available.
Hard Copy