Lignin-based Resins Market Size, Growth & Forecast

Lignin-based Resins Market Size, Share & Trends Analysis Report By Raw Material (Kraft Lignin, Lignosulfonates, Organosolv Lignin), By Product Type (Phenolic Resins, Epoxy Resins, Polyurethane Resins), By Application, By Region, And Segment Forecasts

Published Date: May - 2025 | Publisher: MIR | No of Pages: 230 | Industry: Bulk Chemical | Format: Report available in PDF / Excel Format

View Details Buy Now 2999 Download Free Sample Ask for Discount Request Customization

Lignin-based Resins Market Size & Trends

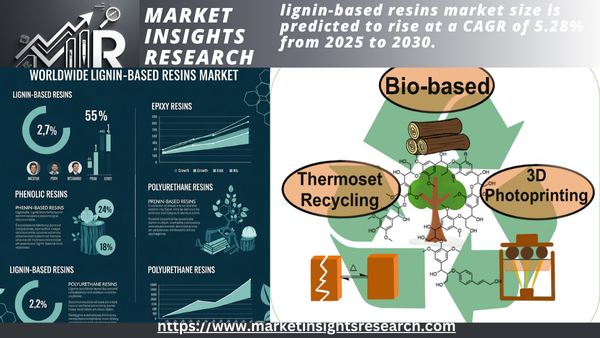
Estimated at USD 512.00 million in 2024, the worldwide lignin-based resins market size is predicted to rise at a CAGR of 5.28% from 2025 to 2030. Rising need to lower carbon emissions is motivating businesses to choose greener solutions, including lignin-based resins.

Lignin-based Resins Market

Download Free Sample   Ask for Discount  Request Customization 

Key Highlights

  • The Asia Pacific lignin-based resin market dominated the global industry and accounted for a share of 39.74% in 2024.
  • The lignin-based resins market in China is experiencing robust growth.
  • Based on product, the phenolic resins segment accounted for the largest share of 57.58% in 2024.
  • Based on application, the Adhesives and binders segment accounts for a share of 47.35% in 2024.

Increasing crude oil prices are making petroleum-based resins pricier, pushing manufacturers to explore cost-effective lignin alternatives. Additionally, a significant trend reshaping the industry is the acceleration of global efforts toward circular economy practices, particularly within the polymer and coatings sectors.

Regulatory mandates and voluntary sustainability goals are pushing manufacturers to transition from petroleum-derived resins to renewable, biodegradable alternatives. Lignin, which comes from the paper and pulping industry, is becoming an important part of bio-based resin formulas because it is widely available, has a lot of carbon, and works well with phenolic and epoxy resins.

Industries such as automotive, electronics, and construction are increasingly adopting lignin-infused resins to meet low-carbon benchmarks and closed-loop material utilization. This pivot not only reduces environmental impact but also aligns product portfolios with next-generation eco-labeling standards, enhancing brand value and long-term market positioning.

Market Size

Download Free Sample   Ask for Discount  Request Customization 

Report Coverage & Deliverables

The PDF report & online dashboard will help you understand

  • Competitive benchmarking
  • Historical data & forecasts
  • Company revenue shares
  • Regional opportunities
  • Latest trends & dynamics

Drivers, Opportunities & Restraints

One of the primary demand drivers for lignin-based resins is the wood panel and engineered wood product industry’s transition toward formaldehyde-free adhesives. Traditional phenol-formaldehyde and urea-formaldehyde resins have long been under scrutiny due to VOC emissions and health hazards, prompting both regulatory agencies and industry stakeholders to seek safer, greener alternatives. Lignin-derived resins provide a beneficial alternative because they bond well and are much less harmful to the environment.

The evolving landscape of lignin valorization technologies presents a major opportunity for market participants aiming to scale up lignin-based resin production. New methods for extracting lignin, like organosolv and enzymatic hydrolysis, are improving the quality and reliability of lignin, improving it for use in high-performance resin products.

Additionally, techniques that alter the chemical structure of lignin, like methylolation, hydroxymethylation, and sulfonation, are opening up new possibilities for using lignin in both types of resin systemsthermosetting and thermoplastic. These advancements improve how well lignin mixes, reacts, and performs, allowing lignin-based resins to compete directly with those made from petroleum.

Even though lignin has enormous potential, its use in commercial products is limited because the technical lignin from industrial processes can vary a lot and is complicated to work with. Lignin's mixed molecular structure, which varies a lot based on the type of raw material and how it's extracted, makes it hard to create consistent and reliable resin products> This variability complicates quality control and limits large-scale industrial adoption, particularly in sectors that require stringent performance specifications.

Market Concentration & Characteristics

The market growth stage is medium, and the pace is accelerating. The industry exhibits a significant level of concentration, with key players dominating the landscape. Major companies like Borregaard, Stora Enso, UPM Biochemicals, MetGen, Ingevity, Lignolix, West Fraser, and others have an important bearing on the market dynamics. These leading players often drive innovation within the market, introducing new products, technologies, and applications to meet evolving industry demands.

The industry is witnessing a high degree of innovation, particularly in material engineering and polymer chemistry. Recent advancements in modifying lignin, such as oxidative depolymerization and catalytic upgrading, are making it simpler to use with various types of thermosetting and thermoplastic resin systems.

Leading R&D institutions and industrial players in Europe and North America are pushing for scalable lignin valorization platforms, backed by public-private funding. These innovations are not just improving resin performance but also unlocking application potential in high-growth sectors like biocomposites, 3D printing, and sustainable coatings.

Regulatory frameworks are an important factor in determining the adoption curve for lignin-based resins. Stringent policies under REACH (EU), TSCA (U.S.), and China's dual-carbon goals are increasingly restricting the use of formaldehyde and non-renewable inputs in resin manufacturing. In parallel, green public procurement standards and building certifications such as LEED and BREEAM are favoring bio-based resin alternatives. These evolving mandates are effectively accelerating investment in lignin-based systems, positioning them as a compliance-ready solution in an era of tightening environmental governance.

Raw Material Insights

The lignosulfonates segment dominated the market, accounting for a share of 76.85% in 2024. The need for lignosulfonates as a raw material in lignin-based resins is increasing because they dissolve well in water and spread easily, making them especially useful in large industrial uses. Recent market trends show that lignosulfonates are being used more in concrete additives and agricultural binders, making it easier to include them in resin systems.

Kraft lignin is predicted to increase at a strong annual growth rate of 4.72% during the forecast period because it has great heat resistance and consistent low molecular weight, making it perform impressively in structural resin uses. Big pulp companies in North America and Scandinavia are starting to sell more kraft lignin by using advanced separation technology, which is making it a better option for phenolic and polyurethane resin systems. As more people want formaldehyde-free options that can withstand high heat, the improvements in the availability and quality of kraft lignin are matching what resin producers need for better material performance.

Product Type Insights

Phenolic resins dominated the market, accounting for a share of 57.58% in 2024. A sharp regulatory pivot against formaldehyde emissions, particularly under the EU's REACH framework and U.S. EPA guidelines, is accelerating the shift toward bio-based phenolic resins.

Lignin, especially from kraft and soda pulping processes, is being used as a partial replacement for phenol to keep the strength of the resin while making it less harmful and better for the environment. Manufacturers in the insulation, automotive, and circuit board industries are using more lignin-based phenolic resins to meet environmental standards and new product certification needs, which is strongly boosting this area.

The epoxy resins segment is anticipated to grow at the fastest CAGR of 5.85% over the forecast period. The segment is experiencing a technology-driven push toward lignin integration, especially in the context of lightweight and sustainable materials for electric vehicles and wind turbine components.

New companies and research groups in Europe and Japan are creating lignin-based epoxies that have better linking and strength by making specific changes to lignin. This wave of new ideas is solving earlier problems with brittleness and thickness, making bio-based epoxy systems more appealing for advanced engineering uses.

Application Insights

Adhesives and binders dominated the market, accounting for a share of 47.35% in 2024. In the adhesives and binders segment, lignin-based resins are gaining strong momentum as manufacturers seek non-toxic, biodegradable alternatives for consumer and industrial use.

Heightened consumer awareness and tightening emissions standards in furniture, packaging, and building materials are steering demand toward lignin-enhanced adhesive formulations. Companies are adding lignin to polyurethane and phenolic resins to create adhesives that produce fewer emissions and are affordable, making this area important for moving toward environmentally friendly chemistry. 

The forecast period projects a substantial CAGR of 5.80% for the composite components segment. The composites segment is being reshaped by growing demand for bio-based, lightweight materials in aerospace and automotive sectors, where lignin-based resins offer a special combination of mechanical strength and carbon footprint reduction.

Partnerships between resin makers and composite part producers are helping to incorporate lignin into thermoset materials, creating components that meet sustainability goals while still performing well. Companies are focusing on lignin-modified epoxy systems to satisfy strength and heat requirements in new composite designs, opening up new business opportunities.

Regional Insights

The North American lignin-based resins market is being driven by expanding demand for low-emission and bio-based alternatives in the automotive and aerospace sectors, particularly for lightweight structural components. The region’s strong innovation ecosystem, coupled with government funding for green chemistry and decarbonization initiatives, is accelerating lignin valorization projects.

North America region

Download Free Sample   Ask for Discount  Request Customization 

U.S. Lignin-based Resins Market Trends

The lignin-based resins market in the U.S. is experiencing a surge in demand for lignin-based resins due to regulatory momentum under the EPA's Safer Choice program and the Inflation Reduction Act’s clean manufacturing incentives. Leading universities and private firms are piloting lignin-based adhesives and composites to replace formaldehyde-based resins in wood products, packaging, and building materials. With federal procurement policies increasingly prioritizing sustainable materials, the U.S. is becoming a testbed for commercial-scale adoption of lignin-derived resin systems.

Asia Pacific Lignin-based Resins Market Trends

The lignin-based resin market in Asia Pacific dominated the global industry and accounted for the largest revenue share of 39.74% in 2024, driven by rapid industrialization, environmental legislation, and the rising cost of petrochemical inputs. Countries like China and India are investing in domestic lignocellulosic biorefinery capacities to support greener manufacturing in packaging, textiles, and automotive sectors. The region’s strong base of pulp and paper production provides a robust lignin feedstock supply, while public and private players are exploring bio-resin adoption to align with low-carbon manufacturing goals.

China's lignin-based resins market is experiencing robust growth, propelled by the nation's strategic emphasis on circular economy initiatives outlined in its 14th Five-Year Plan (2021–2025). The government's commitment to sustainability is fostering increased utilization of lignin-derived materials in various sectors, including construction and wastewater treatment. Notably, China's position as the world's largest paper producer provides a substantial supply of lignin, a by-product of the pulping process, facilitating its integration into resin production.

Europe Lignin-based Resins Market Trends

The lignin-based resins market in Europe is growing due to its stringent climate targets under the European Green Deal and its active circular economy agenda. EU-funded projects like LIGNICOAT and UNRAVEL are facilitating technological advancement and industrial scaling of lignin-derived materials. Additionally, the region’s well-established bioeconomy infrastructure, particularly in Nordic countries, is enabling resin producers to integrate sustainably sourced lignin into value-added applications like coatings, thermosets, and foams.

Key Lignin-based Resins Companies Insights

Key players operating in the lignin-based resins market are undertaking various initiatives to strengthen their presence and increase the reach of their products and services. Strategies such as expansion activities and partnerships are key in propelling the market growth.

Key Lignin-based Resins Companies

The following are the leading companies in the lignin-based resins market. These companies collectively hold the largest market share and dictate industry trends.

Recent Developments

  • In August 2024, Brazil’s Raizen, the world’s largest sugarcane processor, partnered with Dutch biorefinery Vertoro to develop new uses for lignin, a byproduct of second-generation ethanol production. The collaboration aimed to convert lignin into advanced biofuels, chemicals, and materials, enhancing the value of waste from Raizen’s ethanol plants.

  • In May 2025, Swedish greentech company Lignin Industries raised approximately USD 4.2 million (EUR 3.9 million) to accelerate the commercialization of its bio-based thermoplastic, Renol, made from lignin found in trees.

Lignin-based Resins Market Report Scope

Report Attribute

Details

Market size value in 2025

USD 536.03 million

Revenue forecast in 2030

USD 693.22 million

Growth rate

CAGR of 5.28% from 2025 to 2030

Historical data

2018-2024

Forecast period

2025-2030

Quantitative units

Volume in kilotons, revenue in USD million/billion, and CAGR from 2025 to 2030

Report coverage

Volume & revenue forecast, competitive landscape, growth factors, and trends

Segments covered

Raw material, product type, application, region

Regional scope

North America; Europe; Asia Pacific; Latin America; Middle East & Africa

Country scope

U.S., Canada; Mexico; Germany; UK; France; Italy; Spain, China; India; Japan; South Korea, Australia Brazil; Argentina, Saudi Arabia, South Africa, UAE

Key companies profiled

Borregaard; Stora Enso; UPM Biochemicals; MetGen; Ingevity; Lignolix; West Fraser

Customization scope

We offer free report customization, equivalent to up to 8 analysts' working days, with every purchase. Addition or alteration to country, regional & segment scope

Pricing and purchase options

Avail yourself of customized purchase options to meet your exact research needs. Explore purchase options

Lignin-based Resins Market Report Segmentation

This report forecasts volume & revenue growth at the global, regional, and country levels and provides an analysis of the latest industry trends in each of the subsegments from 2018 to 2030. For this study, MIR has segmented the global lignin-based resins market report on the basis of raw material, product type, application, and region

Raw Material Outlook (Volume, Kilotons; Revenue, USD Million, 2018-2030)

    • Kraft Lignin

    • Lignosulfonates

    • Organosolv Lignin

    • Other Materials

  • Product Type Outlook (Volume, Kilotons; Revenue, USD Million, 2018-2030)

    • Phenolic Resins

    • Epoxy Resins

    • Polyurethane Resins

    • Other Products

  • Application Outlook (Volume, Kilotons; Revenue, USD Million, 2018-2030)

    • Adhesives & Binders

    • Coatings

    • Composites

    • Other Applications

  • Regional Outlook (Volume, Kilotons; Revenue, USD Million, 2018-2030)

    • North America

      • U.S.

      • Canada

      • Mexico

    • Europe

      • Germany

      • UK

      • France

      • Italy

      • Spain

    • Asia Pacific

      • China

      • India

      • Japan

      • South Korea

      • Australia

    • Latin America

      • Brazil

      • Argentina

    • Middle East & Africa

      • Saudi Arabia

      • South Africa

      • UAE

Table of Content

Chapter 1. Methodology and Scope
                    1.1. Market Segmentation & Scope
                    1.2. Market Definition
                    1.3. Information Procurement
                        1.3.1. Purchased Database
                        1.3.2. GVR’s Internal Database
                        1.3.3. Secondary Types & Third-Party Perspectives
                        1.3.4. Primary Research
                    1.4. Information Analysis
                        1.4.1. Data Analysis Models
                    1.5. Market Formulation & Data Visualization
                    1.6. Data Validation & Publishing
Chapter 2. Executive Summary
                    2.1. Market Insights
                    2.2. Segmental Outlook
                    2.3. Competitive Outlook
Chapter 3. Lignin-based Resins Market Variables, Trends & Scope
                    3.1. Market Lineage Outlook
                        3.1.1. Parent Market Outlook
                    3.2. Penetration & Growth Prospect Mapping
                    3.3. Industry Value Chain Analysis
                        3.3.1. Profit Margin Analysis of Key Value Chain Participants
                        3.3.2. Raw Material Trends
                        3.3.3. Raw Material Price Analysis
                    3.4. Technology Overview
                        3.4.1. Commercial Production Technology
                        3.4.2. Roadmap of Technology Advancement, 2018 to 2030
                    3.5. Sustainability Trends
                        3.5.1. Recycling and Circular Economy
                    3.6. Average Price Trend Analysis, 2018 to 2030 (USD/kg)
                        3.6.1. Key Factors Influencing Pricing
                    3.7. Supply Demand Gap Analysis
                    3.8. Regulatory Framework
                        3.8.1. Policies and Incentive Plans
                        3.8.2. Standards and Compliances
                        3.8.3. Regulatory Impact Analysis
                    3.9. Market Dynamics
                        3.9.1. Market Driver Analysis
                        3.9.2. Market Restraint Analysis
                        3.9.3. Industry Challenges
                    3.10. Porter’s Five Forces Analysis
                        3.10.1. Supplier Power
                        3.10.2. Buyer Power
                        3.10.3. Substitution Threat
                        3.10.4. Threat from New Entrants
                        3.10.5. Competitive Rivalry
                    3.11. PESTEL Analysis
                        3.11.1. Political Landscape
                        3.11.2. Economic Landscape
                        3.11.3. Social Landscape
                        3.11.4. Technological Landscape
                        3.11.5. Environmental Landscape
                        3.11.6. Legal Landscape
Chapter 4. Lignin-based Resins Market: Raw Material Outlook Estimates & Forecasts
                    4.1. Lignin-based Resins Market: Raw Material Movement Analysis, 2024 & 2030
                        4.1.1. Kraft Lignin
                            4.1.1.1. Market estimates and forecast, 2018 - 2030 (USD Million) (Kilotons)
                        4.1.2. Lignosulfonates
                            4.1.2.1. Market estimates and forecast, 2018 - 2030 (USD Million) (Kilotons)
                        4.1.3. Organosolv Lignin
                            4.1.3.1. Market estimates and forecast, 2018 - 2030 (USD Million) (Kilotons)
                        4.1.4. Other Materials
                            4.1.4.1. Market estimates and forecast, 2018 - 2030 (USD Million) (Kilotons)
Chapter 5. Lignin-based Resins Market: Product Type Outlook Estimates & Forecasts
                    5.1. Lignin-based Resins Market: Product Type Movement Analysis, 2024 & 2030
                        5.1.1. Phenolic Resins
                            5.1.1.1. Market estimates and forecast, 2018 - 2030 (USD Million) (Kilotons)
                        5.1.2. Epoxy Resins
                            5.1.2.1. Market estimates and forecast, 2018 - 2030 (USD Million) (Kilotons)
                        5.1.3. Polyurethane Resins
                            5.1.3.1. Market estimates and forecast, 2018 - 2030 (USD Million) (Kilotons)
                        5.1.4. Other Product Types
                            5.1.4.1. Market estimates and forecast, 2018 - 2030 (USD Million) (Kilotons)
Chapter 6. Lignin-based Resins Market: Application Outlook Estimates & Forecasts
                    6.1. Lignin-based Resins Market: Application Movement Analysis, 2024 & 2030
                        6.1.1. Adhesives & Binders
                            6.1.1.1. Market estimates and forecast, 2018 - 2030 (USD Million) (Kilotons)
                        6.1.2. Coatings
                            6.1.2.1. Market estimates and forecast, 2018 - 2030 (USD Million) (Kilotons)
                        6.1.3. Composites
                            6.1.3.1. Market estimates and forecast, 2018 - 2030 (USD Million) (Kilotons)
                        6.1.4. Other Applications
                            6.1.4.1. Market estimates and forecast, 2018 - 2030 (USD Million) (Kilotons)
Chapter 7. Lignin-based Resins Market Regional Outlook Estimates & Forecasts
                    7.1. Regional Snapshot
                    7.2. Lignin-based Resins Market: Regional Movement Analysis, 2024 & 2030
                    7.3. North America
                        7.3.1. Market estimates and forecast, 2018 - 2030 (USD Million) (Kilotons)
                        7.3.2. Market estimates and forecast, by raw material, 2018 - 2030 (USD Million) (Kilotons)
                        7.3.3. Market estimates and forecast, by product type, 2018 - 2030 (USD Million) (Kilotons)
                        7.3.4. Market estimates and forecast, by application, 2018 - 2030 (USD Million) (Kilotons)
                        7.3.5. U.S.
                            7.3.5.1. Market estimates and forecast, 2018 - 2030 (USD Million) (Kilotons)
                            7.3.5.2. Market estimates and forecast, by raw material, 2018 - 2030 (USD Million) (Kilotons)
                            7.3.5.3. Market estimates and forecast, by product type, 2018 - 2030 (USD Million) (Kilotons)
                            7.3.5.4. Market estimates and forecast, by application, 2018 - 2030 (USD Million) (Kilotons)
                        7.3.6. Canada
                            7.3.6.1. Market estimates and forecast, 2018 - 2030 (USD Million) (Kilotons)
                            7.3.6.2. Market estimates and forecast, by raw material, 2018 - 2030 (USD Million) (Kilotons)
                            7.3.6.3. Market estimates and forecast, by product type, 2018 - 2030 (USD Million) (Kilotons)
                            7.3.6.4. Market estimates and forecast, by application, 2018 - 2030 (USD Million) (Kilotons)
                        7.3.7. Mexico
                            7.3.7.1. Market estimates and forecast, 2018 - 2030 (USD Million) (Kilotons)
                            7.3.7.2. Market estimates and forecast, by raw material, 2018 - 2030 (USD Million) (Kilotons)
                            7.3.7.3. Market estimates and forecast, by product type, 2018 - 2030 (USD Million) (Kilotons)
                            7.3.7.4. Market estimates and forecast, by application, 2018 - 2030 (USD Million) (Kilotons)
                    7.4. Europe
                        7.4.1. Market estimates and forecast, 2018 - 2030 (USD Million) (Kilotons)
                        7.4.2. Market estimates and forecast, by raw material, 2018 - 2030 (USD Million) (Kilotons)
                        7.4.3. Market estimates and forecast, by product type, 2018 - 2030 (USD Million) (Kilotons)
                        7.4.4. Market estimates and forecast, by application, 2018 - 2030 (USD Million) (Kilotons)
                        7.4.5. UK
                            7.4.5.1. Market estimates and forecast, 2018 - 2030 (USD Million) (Kilotons)
                            7.4.5.2. Market estimates and forecast, by raw material, 2018 - 2030 (USD Million) (Kilotons)
                            7.4.5.3. Market estimates and forecast, by product type, 2018 - 2030 (USD Million) (Kilotons)
                            7.4.5.4. Market estimates and forecast, by application, 2018 - 2030 (USD Million) (Kilotons)
                        7.4.6. Germany
                            7.4.6.1. Market estimates and forecast, 2018 - 2030 (USD Million) (Kilotons)
                            7.4.6.2. Market estimates and forecast, by raw material, 2018 - 2030 (USD Million) (Kilotons)
                            7.4.6.3. Market estimates and forecast, by product type, 2018 - 2030 (USD Million) (Kilotons)
                            7.4.6.4. Market estimates and forecast, by application, 2018 - 2030 (USD Million) (Kilotons)
                        7.4.7. France
                            7.4.7.1. Market estimates and forecast, 2018 - 2030 (USD Million) (Kilotons)
                            7.4.7.2. Market estimates and forecast, by raw material, 2018 - 2030 (USD Million) (Kilotons)
                            7.4.7.3. Market estimates and forecast, by product type, 2018 - 2030 (USD Million) (Kilotons)
                            7.4.7.4. Market estimates and forecast, by application, 2018 - 2030 (USD Million) (Kilotons)
                        7.4.8. Italy
                            7.4.8.1. Market estimates and forecast, 2018 - 2030 (USD Million) (Kilotons)
                            7.4.8.2. Market estimates and forecast, by raw material, 2018 - 2030 (USD Million) (Kilotons)
                            7.4.8.3. Market estimates and forecast, by product type, 2018 - 2030 (USD Million) (Kilotons)
                            7.4.8.4. Market estimates and forecast, by application, 2018 - 2030 (USD Million) (Kilotons)
                        7.4.9. Spain
                            7.4.9.1. Market estimates and forecast, 2018 - 2030 (USD Million) (Kilotons)
                            7.4.9.2. Market estimates and forecast, by raw material, 2018 - 2030 (USD Million) (Kilotons)
                            7.4.9.3. Market estimates and forecast, by product type, 2018 - 2030 (USD Million) (Kilotons)
                            7.4.9.4. Market estimates and forecast, by application, 2018 - 2030 (USD Million) (Kilotons)
                    7.5. Asia Pacific
                        7.5.1. Market estimates and forecast, 2018 - 2030 (USD Million) (Kilotons)
                        7.5.2. Market estimates and forecast, by raw material, 2018 - 2030 (USD Million) (Kilotons)
                        7.5.3. Market estimates and forecast, by product type, 2018 - 2030 (USD Million) (Kilotons)
                        7.5.4. Market estimates and forecast, by application, 2018 - 2030 (USD Million) (Kilotons)
                        7.5.5. China
                            7.5.5.1. Market estimates and forecast, 2018 - 2030 (USD Million) (Kilotons)
                            7.5.5.2. Market estimates and forecast, by raw material, 2018 - 2030 (USD Million) (Kilotons)
                            7.5.5.3. Market estimates and forecast, by product type, 2018 - 2030 (USD Million) (Kilotons)
                            7.5.5.4. Market estimates and forecast, by application, 2018 - 2030 (USD Million) (Kilotons)
                        7.5.6. India
                            7.5.6.1. Market estimates and forecast, 2018 - 2030 (USD Million) (Kilotons)
                            7.5.6.2. Market estimates and forecast, by raw material, 2018 - 2030 (USD Million) (Kilotons)
                            7.5.6.3. Market estimates and forecast, by product type, 2018 - 2030 (USD Million) (Kilotons)
                            7.5.6.4. Market estimates and forecast, by application, 2018 - 2030 (USD Million) (Kilotons)
                        7.5.7. Japan
                            7.5.7.1. Market estimates and forecast, 2018 - 2030 (USD Million) (Kilotons)
                            7.5.7.2. Market estimates and forecast, by raw material, 2018 - 2030 (USD Million) (Kilotons)
                            7.5.7.3. Market estimates and forecast, by product type, 2018 - 2030 (USD Million) (Kilotons)
                            7.5.7.4. Market estimates and forecast, by application, 2018 - 2030 (USD Million) (Kilotons)
                        7.5.8. South Korea
                            7.5.8.1. Market estimates and forecast, 2018 - 2030 (USD Million) (Kilotons)
                            7.5.8.2. Market estimates and forecast, by raw material, 2018 - 2030 (USD Million) (Kilotons)
                            7.5.8.3. Market estimates and forecast, by product type, 2018 - 2030 (USD Million) (Kilotons)
                            7.5.8.4. Market estimates and forecast, by application, 2018 - 2030 (USD Million) (Kilotons)
                        7.5.9. Australia
                            7.5.9.1. Market estimates and forecast, 2018 - 2030 (USD Million) (Kilotons)
                            7.5.9.2. Market estimates and forecast, by raw material, 2018 - 2030 (USD Million) (Kilotons)
                            7.5.9.3. Market estimates and forecast, by product type, 2018 - 2030 (USD Million) (Kilotons)
                            7.5.9.4. Market estimates and forecast, by application, 2018 - 2030 (USD Million) (Kilotons)
                    7.6. Latin America
                        7.6.1. Market estimates and forecast, 2018 - 2030 (USD Million) (Kilotons)
                        7.6.2. Market estimates and forecast, by raw material, 2018 - 2030 (USD Million) (Kilotons)
                        7.6.3. Market estimates and forecast, by product type, 2018 - 2030 (USD Million) (Kilotons)
                        7.6.4. Market estimates and forecast, by application, 2018 - 2030 (USD Million) (Kilotons)
                        7.6.5. Brazil
                            7.6.5.1. Market estimates and forecast, 2018 - 2030 (USD Million) (Kilotons)
                            7.6.5.2. Market estimates and forecast, by raw material, 2018 - 2030 (USD Million) (Kilotons)
                            7.6.5.3. Market estimates and forecast, by product type, 2018 - 2030 (USD Million) (Kilotons)
                            7.6.5.4. Market estimates and forecast, by application, 2018 - 2030 (USD Million) (Kilotons)
                        7.6.6. Argentina
                            7.6.6.1. Market estimates and forecast, 2018 - 2030 (USD Million) (Kilotons)
                            7.6.6.2. Market estimates and forecast, by raw material, 2018 - 2030 (USD Million) (Kilotons)
                            7.6.6.3. Market estimates and forecast, by product type, 2018 - 2030 (USD Million) (Kilotons)
                            7.6.6.4. Market estimates and forecast, by application, 2018 - 2030 (USD Million) (Kilotons)
                    7.7. Middle East & Africa
                        7.7.1. Market estimates and forecast, 2018 - 2030 (USD Million) (Kilotons)
                        7.7.2. Market estimates and forecast, by raw material, 2018 - 2030 (USD Million) (Kilotons)
                        7.7.3. Market estimates and forecast, by product type, 2018 - 2030 (USD Million) (Kilotons)
                        7.7.4. Market estimates and forecast, by application, 2018 - 2030 (USD Million) (Kilotons)
                        7.7.5. Saudi Arabia
                            7.7.5.1. Market estimates and forecast, 2018 - 2030 (USD Million) (Kilotons)
                            7.7.5.2. Market estimates and forecast, by raw material, 2018 - 2030 (USD Million) (Kilotons)
                            7.7.5.3. Market estimates and forecast, by product type, 2018 - 2030 (USD Million) (Kilotons)
                            7.7.5.4. Market estimates and forecast, by application, 2018 - 2030 (USD Million) (Kilotons)
                        7.7.6. South Africa
                            7.7.6.1. Market estimates and forecast, 2018 - 2030 (USD Million) (Kilotons)
                            7.7.6.2. Market estimates and forecast, by raw material, 2018 - 2030 (USD Million) (Kilotons)
                            7.7.6.3. Market estimates and forecast, by product type, 2018 - 2030 (USD Million) (Kilotons)
                            7.7.6.4. Market estimates and forecast, by application, 2018 - 2030 (USD Million) (Kilotons)
Chapter 8. Competitive Landscape
                    8.1. Recent Developments & Impact Analysis, By Key Market Participants
                    8.2. Vendor Landscape
                        8.2.1. Company categorization
                        8.2.2. List of Key Distributors and channel Partners
                        8.2.3. List of Potential Customers/End-users
                    8.3. Competitive Dynamics
                        8.3.1. Company Market Share Analysis & Market Positioning
                        8.3.2. Competitive Benchmarking
                        8.3.3. Strategy Mapping
                        8.3.4. Heat Map Analysis
                    8.4. Company Profiles/Listing
                        8.4.1. Participant’s overview
                        8.4.2. Financial performance
                        8.4.3. Product benchmarking
                            8.4.3.1. Borregaard
                            8.4.3.2. Stora Enso
                            8.4.3.3. UPM Biochemicals
                            8.4.3.4. MetGen
                            8.4.3.5. Ingevity
                            8.4.3.6. Lignolix
                            8.4.3.7. West Fraser


List of Tables

Table 1 List of Abbreviations
Table 2 Kraft Lignin market estimates and forecasts, 2018 - 2030 (USD Million) (Kilotons)
Table 3 Lignosulfonates market estimates and forecasts, 2018 - 2030 (USD Million) (Kilotons)
Table 4 Organosolv Lignin market estimates and forecasts, 2018 - 2030 (USD Million) (Kilotons)
Table 5 Other Materials market estimates and forecasts, 2018 - 2030 (USD Million) (Kilotons)
Table 6 Phenolic Resins market estimates and forecasts, 2018 - 2030 (USD Million) (Kilotons)
Table 7 Epoxy Resins market estimates and forecasts, 2018 - 2030 (USD Million) (Kilotons)
Table 8 Polyurethane Resins market estimates and forecasts, 2018 - 2030 (USD Million) (Kilotons)
Table 9 Other Product Types market estimates and forecasts, 2018 - 2030 (USD Million) (Kilotons)
Table 10 Adhesives & Binders market estimates and forecasts, 2018 - 2030 (USD Million) (Kilotons)
Table 11 Coatings market estimates and forecasts, 2018 - 2030 (USD Million) (Kilotons)
Table 12 Composites market estimates and forecasts, 2018 - 2030 (USD Million) (Kilotons)
Table 13 Other Applications market estimates and forecasts, 2018 - 2030 (USD Million) (Kilotons)
Table 14 North America lignin-based resins market estimates and forecasts, by raw material, 2018 - 2030 (USD Million) (Kilotons)
Table 15 North America lignin-based resins market estimates and forecasts, by product type, 2018 - 2030 (USD Million) (Kilotons)
Table 16 North America lignin-based resins market estimates and forecasts, by application, 2018 - 2030 (USD Million) (Kilotons)
Table 17 U.S lignin-based resins market estimates and forecasts, by raw material, 2018 - 2030 (USD Million) (Kilotons)
Table 18 U.S lignin-based resins market estimates and forecasts, by product type, 2018 - 2030 (USD Million) (Kilotons)
Table 19 U.S lignin-based resins market estimates and forecasts, by application, 2018 - 2030 (USD Million) (Kilotons)
Table 20 Canada lignin-based resins market estimates and forecasts, by raw material, 2018 - 2030 (USD Million) (Kilotons)
Table 21 Canada lignin-based resins market estimates and forecasts, by product type, 2018 - 2030 (USD Million) (Kilotons)
Table 22 Canada lignin-based resins market estimates and forecasts, by application, 2018 - 2030 (USD Million) (Kilotons)
Table 23 Mexico lignin-based resins market estimates and forecasts, by raw material, 2018 - 2030 (USD Million) (Kilotons)
Table 24 Mexico lignin-based resins market estimates and forecasts, by product type, 2018 - 2030 (USD Million) (Kilotons)
Table 25 Mexico lignin-based resins market estimates and forecasts, by application, 2018 - 2030 (USD Million) (Kilotons)
Table 26 Europe lignin-based resins market estimates and forecasts, by raw material, 2018 - 2030 (USD Million) (Kilotons)
Table 27 Europe lignin-based resins market estimates and forecasts, by product type, 2018 - 2030 (USD Million) (Kilotons)
Table 28 Europe lignin-based resins market estimates and forecasts, by application, 2018 - 2030 (USD Million) (Kilotons)
Table 29 Germany lignin-based resins market estimates and forecasts, by raw material, 2018 - 2030 (USD Million) (Kilotons)
Table 30 Germany lignin-based resins market estimates and forecasts, by product type, 2018 - 2030 (USD Million) (Kilotons)
Table 31 Germany lignin-based resins market estimates and forecasts, by application, 2018 - 2030 (USD Million) (Kilotons)
Table 32 UK lignin-based resins market estimates and forecasts, by raw material, 2018 - 2030 (USD Million) (Kilotons)
Table 33 UK lignin-based resins market estimates and forecasts, by product type, 2018 - 2030 (USD Million) (Kilotons)
Table 34 UK lignin-based resins market estimates and forecasts, by application, 2018 - 2030 (USD Million) (Kilotons)
Table 35 France lignin-based resins market estimates and forecasts, by raw material, 2018 - 2030 (USD Million) (Kilotons)
Table 36 France lignin-based resins market estimates and forecasts, by product type, 2018 - 2030 (USD Million) (Kilotons)
Table 37 France lignin-based resins market estimates and forecasts, by application, 2018 - 2030 (USD Million) (Kilotons)
Table 38 Italy lignin-based resins market estimates and forecasts, by raw material, 2018 - 2030 (USD Million) (Kilotons)
Table 39 Italy lignin-based resins market estimates and forecasts, by product type, 2018 - 2030 (USD Million) (Kilotons)
Table 40 Italy lignin-based resins market estimates and forecasts, by application, 2018 - 2030 (USD Million) (Kilotons)
Table 41 Spain lignin-based resins market estimates and forecasts, by raw material, 2018 - 2030 (USD Million) (Kilotons)
Table 42 Spain lignin-based resins market estimates and forecasts, by product type, 2018 - 2030 (USD Million) (Kilotons)
Table 43 Spain lignin-based resins market estimates and forecasts, by application, 2018 - 2030 (USD Million) (Kilotons)
Table 44 Asia Pacific lignin-based resins market estimates and forecasts, by raw material, 2018 - 2030 (USD Million) (Kilotons)
Table 45 Asia Pacific lignin-based resins market estimates and forecasts, by product type, 2018 - 2030 (USD Million) (Kilotons)
Table 46 Asia Pacific lignin-based resins market estimates and forecasts, by application, 2018 - 2030 (USD Million) (Kilotons)
Table 47 China lignin-based resins market estimates and forecasts, by raw material, 2018 - 2030 (USD Million) (Kilotons)
Table 48 China lignin-based resins market estimates and forecasts, by product type, 2018 - 2030 (USD Million) (Kilotons)
Table 49 China lignin-based resins market estimates and forecasts, by application, 2018 - 2030 (USD Million) (Kilotons)
Table 50 India lignin-based resins market estimates and forecasts, by raw material, 2018 - 2030 (USD Million) (Kilotons)
Table 51 India lignin-based resins market estimates and forecasts, by product type, 2018 - 2030 (USD Million) (Kilotons)
Table 52 India lignin-based resins market estimates and forecasts, by application, 2018 - 2030 (USD Million) (Kilotons)
Table 53 Japan lignin-based resins market estimates and forecasts, by raw material, 2018 - 2030 (USD Million) (Kilotons)
Table 54 Japan lignin-based resins market estimates and forecasts, by product type, 2018 - 2030 (USD Million) (Kilotons)
Table 55 Japan lignin-based resins market estimates and forecasts, by application, 2018 - 2030 (USD Million) (Kilotons)
Table 56 South Korea lignin-based resins market estimates and forecasts, by raw material, 2018 - 2030 (USD Million) (Kilotons)
Table 57 South Korea lignin-based resins market estimates and forecasts, by product type, 2018 - 2030 (USD Million) (Kilotons)
Table 58 South Korea lignin-based resins market estimates and forecasts, by application, 2018 - 2030 (USD Million) (Kilotons)
Table 59 Australia lignin-based resins market estimates and forecasts, by raw material, 2018 - 2030 (USD Million) (Kilotons)
Table 60 Australia lignin-based resins market estimates and forecasts, by product type, 2018 - 2030 (USD Million) (Kilotons)
Table 61 Australia lignin-based resins market estimates and forecasts, by application, 2018 - 2030 (USD Million) (Kilotons)
Table 62 Latin America lignin-based resins market estimates and forecasts, by raw material, 2018 - 2030 (USD Million) (Kilotons)
Table 63 Latin America lignin-based resins market estimates and forecasts, by product type, 2018 - 2030 (USD Million) (Kilotons)
Table 64 Latin America lignin-based resins market estimates and forecasts, by application, 2018 - 2030 (USD Million) (Kilotons)
Table 65 Brazil lignin-based resins market estimates and forecasts, by raw material, 2018 - 2030 (USD Million) (Kilotons)
Table 66 Brazil lignin-based resins market estimates and forecasts, by product type, 2018 - 2030 (USD Million) (Kilotons)
Table 67 Brazil lignin-based resins market estimates and forecasts, by application, 2018 - 2030 (USD Million) (Kilotons)
Table 68 Argentina lignin-based resins market estimates and forecasts, by raw material, 2018 - 2030 (USD Million) (Kilotons)
Table 69 Argentina lignin-based resins market estimates and forecasts, by product type, 2018 - 2030 (USD Million) (Kilotons)
Table 70 Argentina lignin-based resins market estimates and forecasts, by application, 2018 - 2030 (USD Million) (Kilotons)
Table 71 Middle East & Africa lignin-based resins market estimates and forecasts, by raw material, 2018 - 2030 (USD Million) (Kilotons)
Table 72 Middle East & Africa lignin-based resins market estimates and forecasts, by product type, 2018 - 2030 (USD Million) (Kilotons)
Table 73 Middle East & Africa lignin-based resins market estimates and forecasts, by application, 2018 - 2030 (USD Million) (Kilotons)
Table 74 Saudi Arabia lignin-based resins market estimates and forecasts, by raw material, 2018 - 2030 (USD Million) (Kilotons)
Table 75 Saudi Arabia lignin-based resins market estimates and forecasts, by product type, 2018 - 2030 (USD Million) (Kilotons)
Table 76 Saudi Arabia lignin-based resins market estimates and forecasts, by application, 2018 - 2030 (USD Million) (Kilotons)
Table 77 South Africa lignin-based resins market estimates and forecasts, by raw material, 2018 - 2030 (USD Million) (Kilotons)
Table 78 South Africa lignin-based resins market estimates and forecasts, by product type, 2018 - 2030 (USD Million) (Kilotons)
Table 79 South Africa lignin-based resins market estimates and forecasts, by application, 2018 - 2030 (USD Million) (Kilotons)
Table 80 UAE lignin-based resins market estimates and forecasts, by raw material, 2018 - 2030 (USD Million) (Kilotons)
Table 81 UAE lignin-based resins market estimates and forecasts, by product type, 2018 - 2030 (USD Million) (Kilotons)
Table 82 UAE lignin-based resins market estimates and forecasts, by application, 2018 - 2030 (USD Million) (Kilotons)


List of Figures

Fig. 1 Market segmentation
Fig. 2 Information procurement
Fig. 3 Data Analysis Models
Fig. 4 Market Formulation and Validation
Fig. 5 Market snapshot
Fig. 6 Segmental outlook- Raw Material, Thickness, and Applications
Fig. 7 Competitive outlook
Fig. 8 Value chain analysis
Fig. 9 Market dynamics
Fig. 10 Porter’s Analysis
Fig. 11 PESTEL Analysis
Fig. 12 Lignin-based Resins Market, by Raw Material: Key Takeaways
Fig. 13 Lignin-based Resins Market, by Raw Material: Market share, 2024 & 2030
Fig. 14 Lignin-based Resins Market, by Product Type: Key Takeaways
Fig. 15 Lignin-based Resins Market, by Product Type: Market share, 2024 & 2030
Fig. 16 Lignin-based Resins Market, by Application: Key Takeaways
Fig. 17 Lignin-based Resins Market, by Application: Market share, 2024 & 2030
Fig. 18 Lignin-based Resins Market, by Region: Key takeaways
Fig. 19 Lignin-based Resins Market, by Region: Market share, 2024 & 2030

FAQ'S

For a single, multi and corporate client license, the report will be available in PDF format. Sample report would be given you in excel format. For more questions please contact:

sales@marketinsightsresearch.com

Within 24 to 48 hrs.

You can contact Sales team (sales@marketinsightsresearch.com) and they will direct you on email

You can order a report by selecting payment methods, which is bank wire or online payment through any Debit/Credit card, Razor pay or PayPal.