Medical Reference Apps Market Size, Share & Trends Analysis Report By Application (Drug Information, Medical Condition & Symptoms Management, Medical Calculators), By Platform (Android, iOS), By Device, By End-use, By Region, And Segment Forecasts

Medical Reference Apps Market Size, Share & Trends Analysis Report By Application (Drug Information, Medical Condition & Symptoms Management, Medical Calculators), By Platform (Android, iOS), By Device, By End-use, By Region, And Segment Forecasts

Published Date: April - 2025 | Publisher: MIR | No of Pages: 240 | Industry: healthcare | Format: Report available in PDF / Excel Format

View Details Buy Now 2999 Download Sample Ask for Discount Request Customization

Medical Reference Apps Market Trends

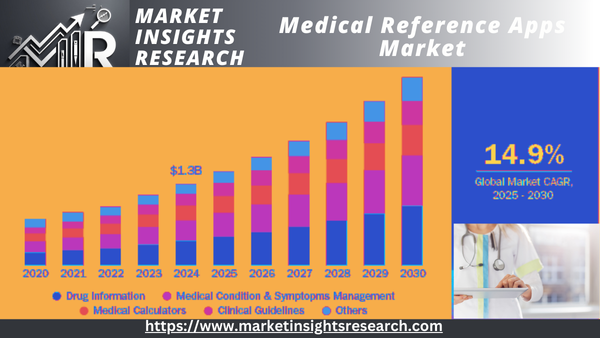
The size of the global medical reference applications market was approximated at USD 1.34 billion in 2024 and is anticipated to develop at a CAGR of 14.9% during 2025-2035. The increasing dependence on digital health solutions, the increasing incorporation of IT in the healthcare sector, the growing need for real-time mHealth data, and the escalating penetration of smartphones among healthcare professionals as well as patients are the primary growth factors for the market. Medical reference apps promote the practice of evidence-based medicine and provide providers and patients with confidence in the selected diagnosis and treatment plans. For instance, Epic Systems' Haiku iPhone app started to enable Doximity members to call patients with a single tap through the mobile EHR. This allows physicians to review health records and talk to patients through mobile phones while hiding their personal phone numbers.

Medical Reference Apps Market

Download Sample  Ask for Discount  Request Customization 

Medical reference apps are a vital tool for medical professionals, granting rapid and dependable access to key medical information. The apps assist in clinical decision-making through evidence-based guidelines, drug interaction checkers, and diagnostic aids. They allow healthcare providers, including physicians and nurses, to find reliable resources such as treatment guidelines, medical dictionaries, and clinical guidelines quickly. With instant access to the newest findings, such applications reduce mistakes, enhance patient results, and increase efficiency in workflow in high-velocity clinical settings. Whether the purpose is verification of a diagnosis or ensuring compatibility of drugs, medical reference software is indispensable for maximizing efficiency and accuracy in care.

A final driver anticipated for driving market expansion is increased take-up of 5G technology worldwide. The penetration of 5G worldwide was estimated to be 54% by 2030, according to a 2023 report released by GSMA. Besides, the greater bandwidth and reduced latency of 5G are expected to support the exchange of images and videos with greater resolution, enhancing the quality and value of virtual communication. This is likely to minimize the requirement to go to a hospital or clinic and be of advantage to remote patients who lack easy access to a medical facility or hospital.

As drug regimen becomes increasingly complex, especially for patients living with chronic illness, there is greater focus on medication, safety, and compliance. Medical reference apps facilitate this demand by providing instant access to complete drug databases, covering interactions, contraindications, dosing recommendations, and side effects. These resources enhance the ability of healthcare professionals to make better prescribing choices with less chance of medication error. For patients, reminders, dose reminders, and educational materials enhance compliance with treatment regimens. Furthermore, the capacity to mark and report adverse drug events (ADEs) supports stronger pharmacovigilance practice. These apps enhance medication safety, ensure compliance, and support better clinical outcomes.

In addition, advancements in healthcare IT technology offer the potential to reduce healthcare expenditure by enhancing care delivery and clinical results. Moreover, the increase in the release of new and innovative medical reference apps increases market growth. For example, in July 2018, EMDEX Nigeria, in partnership with ITmedicus, launched a free EMDEX Drug Information App on the Google Play Store. It has the following features,

Report Coverage & Deliverables

PDF report & online dashboard will help you understand

  • Competitive benchmarking
  • Historical data & forecasts
  • Company revenue shares
  • Regional opportunities
  • Latest trends & dynamics

Market Concentration & Characteristics

The following chart depicts the interrelationship between market concentration, market characteristics, and market players. Market concentration is plotted on the x-axis on a low to high scale. Market characteristics such as degree of innovation, industry competition, service substitutes, and regulatory impact, mergers & acquisition activity levels, and market growth are plotted on the y-axis. For example, the market of medical reference apps is trending towards concentration, with the big players coming out with new products. The level of innovation is high, the level of mergers & acquisitions activity is medium, the market impact of regulations is medium, and the market growth is low to medium.

The worldwide medical reference apps market is defined by high levels of innovation, as a result of the emergence of technologically improved solutions fueled by aspects like improvements in artificial intelligence (AI) capabilities. For example, in June 2024, EASL launched the EASL Guidelines App, which delivers access to the latest and most comprehensive clinical practice guidelines in hepatology. This app was designed to benefit healthcare professionals through the provision of the latest information and resources for managing liver disease and enhancing efficiency and effectiveness in clinical settings.

The medical reference apps industry is marked by medium merger and acquisition activity due to a variety of reasons such as the intention to extend the business to accommodate the increasing need for sophisticated solutions in order to stay competitive and access new technology and innovations and the necessity to consolidate in an increasingly expanding market.

The laws and regulations for the utilization of medical reference apps technologies are different in different countries and regions. Nevertheless, possessing a clear regulatory framework favorably affects market accessibility, expansion, and conformity. In Europe, the legal environment for the mHealth services market is regulated by EU directives and domestic laws.

The EU Medical Device Regulation (MDR) prescribes standards for the safety and performance of medical devices, including mobile health applications and devices.

As of May 26th, 2021, the MDR took effect, resulting in a higher number of medical apps that are considered medical devices. The manufacturers must follow the Medical Devices Regulation's core guidelines, such as ISO 13485, ISO 17021, ISO 14971, and ISO/TS 82304-2.

The General Data Protection Regulation (GDPR) establishes extensive rules for the protection of personal data, including health data processed by mHealth apps and devices.

Players in the market are broadening their operations by entering new geographic areas and introducing new tools to improve their market presence and broaden their portfolio of products. For example, in November 2021, Merck & Co., Inc., a US pharmaceutical company, introduced Merck Manuals, a digital medical guide for healthcare professionals and consumers within Microsoft Teams. This complimentary application, downloadable on the Microsoft Teams app store and Microsoft AppSource, enables Microsoft Teams users to tap into a shared source of authoritative medical information.

Application Insights

The drug information segment led the market with the highest revenue share of 30.48% in 2024. Drug information applications are becoming more integrated into electronic health records (EHRs) and clinical decision support systems (CDSS) to ease prescribing and drug administration workflow processes. The integrations enable autoalerts for drug contraindications, allergies, and dosing changes, especially in high-risk environments like intensive care units (ICUs) and oncology clinics. This integration increases patient safety and clinical effectiveness. In addition, healthcare providers depend on drug information applications like Lexicomp, Epocrates, and Drugs.com to safely administer these regimens, screen for drug-drug interactions, and accurately dose.

The medical condition & symptoms management segment is expected to expand at the highest CAGR during the forecast period. Governments and health care facilities increasingly see the potential of mHealth solutions, such as medical condition and symptom management applications, in the increase of health care access. For example, in October 2023, the World Health Organization (WHO) launched a new version of the Skin NTDs App, a solution created to enable frontline health care workers to diagnose and treat skin-related neglected tropical diseases (skin NTDs). The new app is available without cost for both Android and iOS. Some of the most important features of the new app include logical, offline algorithm, support for different languages, learning materials, and state-of-the-art ai integration (Beta).

Platform Insights

The iOS segment led the market with a revenue share of 51.04% in 2024, as a result of high adoption of iOS devices is one of the key drivers of growth and is also likely to further drive the segment during the forecast period. For example, based on the Demandsage report, as of 2023, there were 153 million iPhone users in the U.S. Furthermore, as per the Backlinko report, in 2023, Apple shipped 231.8 million iPhones worldwide. Additionally, the increasing use of iOS-based medical reference apps by the government in healthcare environments accelerates market growth. For example, in April 2024, the Indian Union Health Ministry launched the myCGHS app for iOS devices to enhance access to EHR, resources, and information for the Central Government Health Scheme (CGHS) beneficiaries.

The segment for android is expected to expand at the highest CAGR during the forecast period. Additionally, the high popularity of Android smartphones across the world is projected to propel segment growth during the forecast period. According to the Backlinko report, as of Q4 2023, Android smartphones accounted for 56% of global quarterly sales of smartphones. In addition, the Android operating system has been constantly improved. These consist of bolstered Application Programming Interface (API) integrations and machine learning abilities. These improve the functionality and precision of medical reference applications.

Device Insights

The smartphones segment dominated the market with a revenue share of 65.97% in 2024. Growth in the segment is attributed to the increasing penetration of smartphones globally. According to an article in The Hindu, over 2 billion 5G smartphones were shipped worldwide in the last quarter of 2023, with China, the U.S., and Western Europe accounting for almost 70% of all 5G shipments. In addition, the cost & availability of 5G smartphones increased as the price difference between 5G and 4G chipsets narrowed, contributing to segment growth.

The tablets segment is expected to grow at the significant rate during the forecast period. One of the major drivers for tablets is their ability to run multiple apps simultaneously. Healthcare professionals can reference drug interaction tools, patient charts, and condition management guidelines all on a single device without the screen constraints of smartphones. This multi-window functionality supports real-time clinical decision-making, especially in high-pressure settings such as ICUs and surgery centers. Thus, such benefits offered by tablets drive their adoption rate and propel the market growth.

End-use Insights

The healthcare providers segment dominated the market with a revenue share of 50.70% in 2024 and is anticipated to grow at the fastest CAGR over the forecast period. Healthcare practitioners increasingly adopt medical reference apps to improve patient care and operational efficiency. For example, Asan Medical Center (AMC), one of South Korea's tertiary hospitals, has developed several in-house medical apps to support clinical practice, such as My Medication, which provides detailed drug information, including indications, dosages, interactions, and side effects. It was downloaded over 70,000 times in a single year, reflecting its widespread use among healthcare professionals.

In addition, modern healthcare demands streamlined workflows and reduced administrative burden. Many medical reference apps are integrated directly into electronic health record (EHR) systems, allowing providers to check drug interactions, lab value ranges, or clinical calculators without switching platforms. This seamless integration supports time savings, reduces decision fatigue, and minimizes disruptions in clinical care delivery. Thus, such advantages of medical reference apps boost their adoption among healthcare providers.

Regional Insights

Market Analysis

Download Sample  Ask for Discount  Request Customization 

North America medical reference apps market was the market leader in the global market with a revenue market share of 37.66% in 2024. A combination of various factors, including a high rate of adoption of sophisticated healthcare technologies, availability of a vast number of healthcare professionals, and availability of well-established healthcare infrastructures, combined with a growing emphasis on digital health and health solutions, have propelled widespread use of medical reference apps in this region. In addition, the increasing smartphone penetration is one of the major drivers anticipated to enhance the use of medical reference apps across the region. For example, as indicated by Business of Apps, more than 30 million people have engaged actively with smartphones in Canada yearly since 2020, and 31.2 million users were reported in 2023.

U.S. Medical Reference Apps Market Trends

The U.S. dominated the medical reference apps industry in the North America region in 2024 due to advanced healthcare management, innovative software development, and numerous key players operating in the country. For instance, in November 2023, PatientPoint launched Impact Calculator, developed to efficiently support hospitals and health systems and quickly determine how the patient engagement platform drives growth within key service lines, procedures, and other strategic initiatives.

Europe Medical Reference Apps Market Trends

The medical reference apps industry in Europe is expected to grow significantly over the forecast period. This growth is attributed to the government's backing and equal adoption of digital health and mHealth technology by the National Health Services (NHS) and small physicians to improve access to healthcare. In addition, various technology companies are actively working with academic institutes, clinicians, and policymakers to develop solutions that meet patient and clinician needs.

The medical reference apps market in France is expected to grow significantly during the forecast period, as there is a significant expenditure on health. the increasing adoption of novel and advanced technologies in various sectors of the country, including healthcare, is one of the factors driving the adoption of digital health services. Moreover, France’s Health Minister Olivier Véran announced an investment plan of USD 707.1 million to speed up the national digital health strategy as part of the Health Innovation 2035 plan.

Asia Pacific Medical Reference Apps Market Trends

The Asia Pacific medical reference apps market is expected to register the fastest growth rate over the forecast period. The growing awareness and demand for convenient healthcare solutions among Asia Pacific consumers contribute to expanding the medical reference apps market. In addition, the widespread adoption of smartphones and improved Internet connectivity have made fitness apps more accessible to a broader audience. According to The Mobile Economy 2023 by GSMA, unique mobile subscriptions in Asia Pacific reached 1.73 billion by the end of 2022, estimated to reach 2.11 billion by 2023.

China medical reference apps market is anticipated to register considerable growth during the forecast period. The growing patient population and increasing internet penetration in China can spur the country’s market. According to data from the China Internet Network Information Center (CNNIC), as of December 2022, China has 1.067 billion Internet users, an increase of 35.49 million since December 2021. Internet penetration has increased by 2.6%, reaching 75.6%. Moreover, the increasing use of smartphones is expected to drive the adoption of mobile platforms for various healthcare services.

Latin America Medical Reference Apps Market Trends

Medical reference apps industry in Latin America is anticipated to witness considerable growth over the forecast period. Healthcare providers such as hospitals, clinics, and medical professionals are increasingly recognizing the potential benefits of mHealth technologies. These technologies help streamline workflows, increase patient engagement, and provide more personalized care. Thus, the integration and acceptance of mHealth into the broader healthcare ecosystem are driving the market in Latin America.

Brazil medical reference apps market is anticipated to register considerable growth during the forecast period. The increasing adoption of digital technology and the growing healthcare sector are key factors facilitating Brazil's medical reference apps market growth. Furthermore, increasing collaborations between the government and private investors to promote the digitalization of healthcare services are expected to propel market growth in Brazil.

Middle East and Africa Medical Reference Apps Market Trends

The medical reference apps market in the Middle East and Africa is anticipated to witness considerable growth over the forecast period. mHealth solutions are transforming healthcare in the Middle East and Africa (MEA), driven by the expanding internet connectivity and government initiatives. In addition, the rising awareness regarding digital health among people has increased the potential for market growth.

UAE medical reference apps market is anticipated to register considerable growth during the forecast period. The UAE is one of the most favorable markets for mHealth and digital platforms. The medical reference apps market in South Africa is experiencing rapid growth due to the increasing smartphone penetration, improving internet connectivity, and government initiatives promoting mHealth adoption.

Key Medical Reference Apps Company Insights

Key participants in the medical reference apps industry are focusing on devising innovative business growth strategies, such as expanding their product portfolios, partnerships and collaborations, mergers and acquisitions, and expanding their business footprints.

Recent Developments

  • In March 2025, Elsevier, a health information and data analytics company, enhanced its ClinicalKey AI solution, a clinical decision support tool powered by generative AI. The latest updates and partnerships are designed to revolutionize how healthcare providers access and employ actionable insights, improving patient care and efficiency directly within clinicians' workflows.

  • In August 2024, nib New Zealand, a private health insurance provider, launched an AI-powered symptom checker to assist Kiwis in effectively navigating the healthcare system by guiding them to the right treatment options based on their specific needs.

Key Medical Reference Apps Companies

The following are the leading companies in the medical reference apps market. These companies collectively hold the largest market share and dictate industry trends.

Medical Reference Apps Market Report Scope

Report Attribute

Details

Market size value in 2025

USD 1.55 billion

Revenue forecast in 2030

USD 3.10 billion

Growth rate

CAGR of 14.9% from 2025 to 2035

Actual data

2018 - 2025

Forecast data

2025 - 2035

Quantitative units

Revenue in USD million/billion and CAGR from 2025 to 2035

Report coverage

Revenue forecast, company ranking, competitive landscape, growth factors, and trends

Segments covered

Application, platform, device, end-use, region

Regional scope

North America; Europe; Asia Pacific; Latin America; MEA

Country scope

U.S.; Canada; Mexico; UK; Germany; Spain; France; Italy; Spain; Denmark; Sweden; Norway; China; Japan; India; Australia; South Korea; Thailand; Brazil; Argentina; South Africa; Saudi Arabia; UAE; Kuwait

Key companies profiled

Medscape; Epocrates; DynaMed Plus; UpToDate Lexidrug (formerly Lexicomp); VisualDX; Micromedex (Merative US L.P.); Figure 1; QxMD Read; Skyscape; Medical Library; MedlinePlus

Customization scope

Free report customization (equivalent up to 8 analysts working days) with purchase. Addition or alteration to country, regional & segment scope.

Pricing and purchase options

Avail customized purchase options to meet your exact research needs. Explore purchase options

Download Sample  Ask for Discount  Request Customization 

Global Medical Reference Apps Market Report Segmentation

This report forecasts revenue growth and provides at global, regional, and country levels an analysis of the latest trends in each of the sub-segments from 2018 to 2030. For this report, Grand View Research has segmented the global medical reference apps market report based on application, platform, device, end-use, and region

  • Application Outlook (Revenue, USD Million, 2018 - 2035)

    • Drug Information

    • Medical Condition & Symptoms Management

    • Medical Calculators

    • Clinical Guidelines

    • Others (Medical News, Articles & Educational Reference Materials)

  • Platform Outlook (Revenue, USD Million, 2018 - 2035)

    • Android

    • iOS

    • Others

  • Device Outlook (Revenue, USD Million, 2018 - 2035)

    • Smartphones

    • Tablets

  • End-use Outlook (Revenue, USD Million, 2018 - 2035)

    • Healthcare Providers

    • Patients

    • Others

  • Regional Outlook (Revenue, USD Million, 2018 - 2035)

    • North America

      • U.S.

      • Canada

      • Mexico

    • Europe

      • UK

      • Germany

      • France

      • Italy

      • Spain

      • Denmark

      • Sweden

      • Norway

    • Asia Pacific

      • Japan

      • China

      • India

      • Australia

      • South Korea

      • Thailand

    • Latin America

      • Brazil

      • Argentina

    • Middle East & Africa

      • South Africa

      • Saudi Arabia

      • UAE

      • Kuwait

Table of Content

Chapter 1. Methodology and Scope
                    1.1. Market Segmentation & Scope
                        1.1.1. Segment scope
                        1.1.2. Regional scope
                        1.1.3. Estimates and forecast timeline
                    1.2. Research Methodology
                    1.3. Information Procurement
                        1.3.1. Purchased database
                        1.3.2. GVR’s internal database
                        1.3.3. Secondary sources
                        1.3.4. Primary research
                        1.3.5. Details of primary research
                    1.4. Information or Data Analysis
                        1.4.1. Data analysis models
                    1.5. Market Formulation & Validation
                    1.6. Model Details
                        1.6.1. Commodity flow analysis (Model 1)
                            1.6.1.1. Approach 1: Commodity flow approach
                    1.7. Research Assumptions
                    1.8. List of Secondary Sources
                    1.9. List of Primary Sources
Chapter 2. Executive Summary
                    2.1. Market Outlook
                    2.2. Segment Outlook
                        2.2.1. Application outlook
                        2.2.2. Platform outlook
                        2.2.3. Device outlook
                        2.2.4. Regional outlook
                    2.3. Competitive Insights
Chapter 3. Medical Reference Apps Market Variables, Trends & Scope
                    3.1. Market Lineage Outlook
                        3.1.1. Parent market outlook
                        3.1.2. Ancillary market outlook
                    3.2. Market Dynamics
                        3.2.1. Market driver analysis
                        3.2.2. Market restraint analysis
                    3.3. Medical Reference Apps: Market Analysis Tools
                        3.3.1. Industry Analysis - Porter’s Five Forces Analysis
                            3.3.1.1. Supplier Power
                            3.3.1.2. Buyer Power
                            3.3.1.3. Substitution Threat
                            3.3.1.4. Threat of New Entrants
                            3.3.1.5. Competitive Rivalry
                        3.3.2. PESTLE Analysis
                    3.4. Regulatory Landscape
                    3.5. Medical Reference Apps Market Ecosystem
                    3.6. Medical Reference Apps Market Key Evaluation Metrix (active users, retention rate, conversion rate)
                    3.7. Digital Health Market Ecosystem
                    3.8. Digital Health Market Funding Scenario
                    3.9. Technology Landscape
                    3.10. Case Study Analysis
Chapter 4. Medical Reference Apps Market Segment Analysis, By Application, 2018 - 2030 (USD Million)
                    4.1. Definition and Scope
                    4.2. Application Market Share Analysis, 2024 & 2030
                    4.3. Segment Dashboard
                    4.4. Global Medical Reference Apps Market, by Application, 2018 to 2030
                    4.5. Drug Information
                        4.5.1. Drug Information Market Revenue Estimates and Forecasts, 2018 - 2030 (USD Million)
                    4.6. Medical Condition & Symptoms Management
                        4.6.1. Medical Condition & Symptoms Management Market Revenue Estimates and Forecasts, 2018 - 2030 (USD Million)
                    4.7. Medical Calculators
                        4.7.1. Medical Calculators Market Revenue Estimates and Forecasts, 2018 - 2030 (USD Million)
                    4.8. Clinical Guidelines
                        4.8.1. Clinical Guidelines Market Revenue Estimates and Forecasts, 2018 - 2030 (USD Million)
                    4.9. Others
                        4.9.1. Others Market Revenue Estimates and Forecasts, 2018 - 2030 (USD Million)
Chapter 5. Medical Reference Apps Market Segment Analysis, By Platform, 2018 - 2030 (USD Million)
                    5.1. Definition and Scope
                    5.2. Platform Market Share Analysis, 2024 & 2030
                    5.3. Segment Dashboard
                    5.4. Global Medical Reference Apps Market, by Platform, 2018 to 2030
                    5.5. Android
                        5.5.1. Android Market Revenue Estimates and Forecasts, 2018 - 2030 (USD Million)
                    5.6. iOS
                        5.6.1. iOS Market Revenue Estimates and Forecasts, 2018 - 2030 (USD Million)
                    5.7. Others
                        5.7.1. Others Market Revenue Estimates and Forecasts, 2018 - 2030 (USD Million)
Chapter 6. Medical Reference Apps Market Segment Analysis, By Device, 2018 - 2030 (USD Million)
                    6.1. Definition and Scope
                    6.2. Device Market Share Analysis, 2024 & 2030
                    6.3. Segment Dashboard
                    6.4. Global Medical Reference Apps Market, by Device, 2018 to 2030
                    6.5. Smartphones
                        6.5.1. Smartphones Market Revenue Estimates and Forecasts, 2018 - 2030 (USD Million)
                    6.6. Tablets
                        6.6.1. Tablets Market Revenue Estimates and Forecasts, 2018 - 2030 (USD Million)
Chapter 7. Medical Reference Apps Market Segment Analysis, By End Use, 2018 - 2030 (USD Million)
                    7.1. Definition and Scope
                    7.2. End Use Market Share Analysis, 2024 & 2030
                    7.3. Segment Dashboard
                    7.4. Global Medical Reference Apps Market, by End Use, 2018 to 2030
                    7.5. Healthcare Providers
                        7.5.1. Healthcare Providers Market Revenue Estimates and Forecasts, 2018 - 2030 (USD Million)
                    7.6. Patients
                        7.6.1. Patients Market Revenue Estimates and Forecasts, 2018 - 2030 (USD Million)
                    7.7. Others
                        7.7.1. Others Market Revenue Estimates and Forecasts, 2018 - 2030 (USD Million)
Chapter 8. Medical Reference Apps Market Segment Analysis, By Region, 2018- 2030 (USD Million)
                    8.1. Regional Market Share Analysis, 2024 & 2030
                    8.2. Regional Market Dashboard
                    8.3. Regional Market Snapshot
                    8.4. Medical Reference Apps Market Share by Region, 2024 & 2030:
                    8.5. North America
                        8.5.1. North America medical reference apps market, 2018 - 2030 (USD Million)
                        8.5.2. U.S.
                            8.5.2.1. Key Country Dynamics
                            8.5.2.2. Regulatory Scenario
                            8.5.2.3. Competitive Scenario
                            8.5.2.4. U.S. medical reference apps market, 2018 - 2030 (USD Million)
                        8.5.3. Canada
                            8.5.3.1. Key Country Dynamics
                            8.5.3.2. Regulatory Scenario
                            8.5.3.3. Competitive Scenario
                            8.5.3.4. Canada medical reference apps market, 2018 - 2030 (USD Million)
                        8.5.4. Mexico
                            8.5.4.1. Key Country Dynamics
                            8.5.4.2. Regulatory Scenario
                            8.5.4.3. Competitive Scenario
                            8.5.4.4. Mexico medical reference apps market, 2018 - 2030 (USD Million)
                    8.6. Europe
                        8.6.1. Europe medical reference apps market, 2018 - 2030 (USD Million)
                        8.6.2. UK
                            8.6.2.1. Key Country Dynamics
                            8.6.2.2. Regulatory Scenario
                            8.6.2.3. Competitive Scenario
                            8.6.2.4. UK medical reference apps market, 2018 - 2030 (USD Million)
                        8.6.3. Germany
                            8.6.3.1. Key Country Dynamics
                            8.6.3.2. Regulatory Scenario
                            8.6.3.3. Competitive Scenario
                            8.6.3.4. Germany medical reference apps market, 2018 - 2030 (USD Million)
                        8.6.4. France
                            8.6.4.1. Key Country Dynamics
                            8.6.4.2. Regulatory Scenario
                            8.6.4.3. Competitive Scenario
                            8.6.4.4. France medical reference apps market, 2018 - 2030 (USD Million)
                        8.6.5. Italy
                            8.6.5.1. Key Country Dynamics
                            8.6.5.2. Regulatory Scenario
                            8.6.5.3. Competitive Scenario
                            8.6.5.4. Italy medical reference apps market, 2018 - 2030 (USD Million)
                        8.6.6. Spain
                            8.6.6.1. Key Country Dynamics
                            8.6.6.2. Regulatory Scenario
                            8.6.6.3. Competitive Scenario
                            8.6.6.4. Spain medical reference apps market, 2018 - 2030 (USD Million)
                        8.6.7. Norway
                            8.6.7.1. Key Country Dynamics
                            8.6.7.2. Regulatory Scenario
                            8.6.7.3. Competitive Scenario
                            8.6.7.4. Norway medical reference apps market, 2018 - 2030 (USD Million)
                        8.6.8. Sweden
                            8.6.8.1. Key Country Dynamics
                            8.6.8.2. Regulatory Scenario
                            8.6.8.3. Competitive Scenario
                            8.6.8.4. Sweden medical reference apps market, 2018 - 2030 (USD Million)
                        8.6.9. Denmark
                            8.6.9.1. Key Country Dynamics
                            8.6.9.2. Regulatory Scenario
                            8.6.9.3. Competitive Scenario
                            8.6.9.4. Denmark medical reference apps market, 2018 - 2030 (USD Million)
                    8.7. Asia Pacific
                        8.7.1. Japan
                            8.7.1.1. Key Country Dynamics
                            8.7.1.2. Regulatory Scenario
                            8.7.1.3. Competitive Scenario
                            8.7.1.4. Japan medical reference apps market, 2018 - 2030 (USD Million)
                        8.7.2. China
                            8.7.2.1. Key Country Dynamics
                            8.7.2.2. Regulatory Scenario
                            8.7.2.3. Competitive Scenario
                            8.7.2.4. China medical reference apps market, 2018 - 2030 (USD Million)
                        8.7.3. India
                            8.7.3.1. Key Country Dynamics
                            8.7.3.2. Regulatory Scenario
                            8.7.3.3. Competitive Scenario
                            8.7.3.4. India medical reference apps market, 2018 - 2030 (USD Million)
                        8.7.4. Australia
                            8.7.4.1. Key Country Dynamics
                            8.7.4.2. Regulatory Scenario
                            8.7.4.3. Competitive Scenario
                            8.7.4.4. Australia medical reference apps market, 2018 - 2030 (USD Million)
                        8.7.5. South Korea
                            8.7.5.1. Key Country Dynamics
                            8.7.5.2. Regulatory Scenario
                            8.7.5.3. Competitive Scenario
                            8.7.5.4. South Korea medical reference apps market, 2018 - 2030 (USD Million)
                        8.7.6. Thailand
                            8.7.6.1. Key Country Dynamics
                            8.7.6.2. Regulatory Scenario
                            8.7.6.3. Competitive Scenario
                            8.7.6.4. Thailand medical reference apps market, 2018 - 2030 (USD Million)
                    8.8. Latin America
                        8.8.1. Brazil
                            8.8.1.1. Key Country Dynamics
                            8.8.1.2. Regulatory Scenario
                            8.8.1.3. Competitive Scenario
                            8.8.1.4. Brazil medical reference apps market, 2018 - 2030 (USD Million)
                        8.8.2. Argentina
                            8.8.2.1. Key Country Dynamics
                            8.8.2.2. Regulatory Scenario
                            8.8.2.3. Competitive Scenario
                            8.8.2.4. Argentina medical reference apps market, 2018 - 2030 (USD Million)
                    8.9. MEA
                        8.9.1. South Africa
                            8.9.1.1. Key Country Dynamics
                            8.9.1.2. Regulatory Scenario
                            8.9.1.3. Competitive Scenario
                            8.9.1.4. South Africa medical reference apps market, 2018 - 2030 (USD Million)
                        8.9.2. Saudi Arabia
                            8.9.2.1. Key Country Dynamics
                            8.9.2.2. Regulatory Scenario
                            8.9.2.3. Competitive Scenario
                            8.9.2.4. Saudi Arabia medical reference apps market, 2018 - 2030 (USD Million)
                        8.9.3. UAE
                            8.9.3.1. Key Country Dynamics
                            8.9.3.2. Regulatory Scenario
                            8.9.3.3. Competitive Scenario
                            8.9.3.4. UAE medical reference apps market, 2018 - 2030 (USD Million)
                        8.9.4. Kuwait
                            8.9.4.1. Key Country Dynamics
                            8.9.4.2. Regulatory Scenario
                            8.9.4.3. Competitive Scenario
                            8.9.4.4. Kuwait medical reference apps market, 2018 - 2030 (USD Million)
Chapter 9. Competitive Landscape
                    9.1. Recent Developments & Impact Analysis, By Key Market Participants
                    9.2. Company Categorization
                    9.3. Company Profiles
                        9.3.1. Medscape
                            9.3.1.1. Company overview
                            9.3.1.2. Financial performance
                            9.3.1.3. Platform benchmarking
                            9.3.1.4. Strategic initiatives
                        9.3.2. Epocrates
                            9.3.2.1. Company overview
                            9.3.2.2. Financial performance
                            9.3.2.3. Platform benchmarking
                            9.3.2.4. Strategic initiatives
                        9.3.3. DynaMed Plus
                            9.3.3.1. Company overview
                            9.3.3.2. Financial performance
                            9.3.3.3. Platform benchmarking
                            9.3.3.4. Strategic initiatives
                        9.3.4. UpToDate Lexidrug (formerly Lexicomp)
                            9.3.4.1. Company overview
                            9.3.4.2. Financial performance
                            9.3.4.3. Platform benchmarking
                            9.3.4.4. Strategic initiatives
                        9.3.5. VisualDX
                            9.3.5.1. Company overview
                            9.3.5.2. Financial performance
                            9.3.5.3. Platform benchmarking
                            9.3.5.4. Strategic initiatives
                        9.3.6. Micromedex (Merative US L.P.)
                            9.3.6.1. Company overview
                            9.3.6.2. Financial performance
                            9.3.6.3. Platform benchmarking
                            9.3.6.4. Strategic initiatives
                        9.3.7. Figure 1
                            9.3.7.1. Company overview
                            9.3.7.2. Financial performance
                            9.3.7.3. Platform benchmarking
                            9.3.7.4. Strategic initiatives
                        9.3.8. QxMD Read
                            9.3.8.1. Company overview
                            9.3.8.2. Financial performance
                            9.3.8.3. Platform benchmarking
                            9.3.8.4. Strategic initiatives
                        9.3.9. Skyscape Medical Library
                            9.3.9.1. Company overview
                            9.3.9.2. Financial performance
                            9.3.9.3. Platform benchmarking
                            9.3.9.4. Strategic initiatives
                        9.3.10. MedlinePlus
                            9.3.10.1. Company overview
                            9.3.10.2. Financial performance
                            9.3.10.3. Platform benchmarking
                            9.3.10.4. Strategic initiatives


List of Tables

Table 1. List of secondary sources
Table 2. List of abbreviations
Table 3. Global Medical Reference Apps Market, By Application, 2018 - 2030 (USD Million)
Table 4. Global Medical Reference Apps Market, By Platform, 2018 - 2030 (USD Million)
Table 5. Global Medical Reference Apps Market, By Device, 2018 - 2030 (USD Million)
Table 6. Global Medical Reference Apps Market, By End Use, 2018 - 2030 (USD Million)
Table 7. Global Medical Reference Apps Market, By Region, 2018 - 2030 (USD Million)
Table 8. North America Medical Reference Apps Market, By Country, 2018 - 2030 (USD Million)
Table 9. North America Medical Reference Apps Market, By Application, 2018 - 2030 (USD Million)
Table 10. North America Medical Reference Apps Market, By Platform, 2018 - 2030 (USD Million)
Table 11. North America Medical Reference Apps Market, By Device, 2018 - 2030 (USD Million)
Table 12. North America Medical Reference Apps Market, By End Use, 2018 - 2030 (USD Million)
Table 13. U.S. Medical Reference Apps Market, by Application, 2018 - 2030 (USD Million)
Table 14. U.S. Medical Reference Apps Market, By Platform, 2018 - 2030 (USD Million)
Table 15. U.S. Medical Reference Apps Market, By Device, 2018 - 2030 (USD Million)
Table 16. U.S. Medical Reference Apps Market, By End Use, 2018 - 2030 (USD Million)
Table 17. Canada Medical Reference Apps Market, by Application, 2018 - 2030 (USD Million)
Table 18. Canada Medical Reference Apps Market, By Platform, 2018 - 2030 (USD Million)
Table 19. Canada Medical Reference Apps Market, By Device, 2018 - 2030 (USD Million)
Table 20. Canada Medical Reference Apps Market, By End Use, 2018 - 2030 (USD Million)
Table 21. Mexico Medical Reference Apps Market, by Application, 2018 - 2030 (USD Million)
Table 22. Mexico Medical Reference Apps Market, by Platform, 2018 - 2030 (USD Million)
Table 23. Mexico Medical Reference Apps Market, By Device, 2018 - 2030 (USD Million)
Table 24. Mexico Medical Reference Apps Market, By End Use, 2018 - 2030 (USD Million)
Table 25. Europe Medical Reference Apps Market, by Country, 2018 - 2030 (USD Million)
Table 26. Europe Medical Reference Apps Market, by Application, 2018 - 2030 (USD Million)
Table 27. Europe Medical Reference Apps Market, By Platform, 2018 - 2030 (USD Million)
Table 28. Europe Medical Reference Apps Market, By Device, 2018 - 2030 (USD Million)
Table 29. Europe Medical Reference Apps Market, By End Use, 2018 - 2030 (USD Million)
Table 30. UK Medical Reference Apps Market, by Application, 2018 - 2030 (USD Million)
Table 31. UK Medical Reference Apps Market, By Platform, 2018 - 2030 (USD Million)
Table 32. UK Medical Reference Apps Market, By Device, 2018 - 2030 (USD Million)
Table 33. UK Medical Reference Apps Market, By End Use, 2018 - 2030 (USD Million)
Table 34. Germany Medical Reference Apps Market, by Application, 2018 - 2030 (USD Million)
Table 35. Germany Medical Reference Apps Market, by Platform, 2018 - 2030 (USD Million)
Table 36. Germany Medical Reference Apps Market, By Device, 2018 - 2030 (USD Million)
Table 37. Germany Medical Reference Apps Market, By End Use, 2018 - 2030 (USD Million)
Table 38. France Medical Reference Apps Market, by Application, 2018 - 2030 (USD Million)
Table 39. France Medical Reference Apps Market, by Platform, 2018 - 2030 (USD Million)
Table 40. France Medical Reference Apps Market, By Device, 2018 - 2030 (USD Million)
Table 41. France Medical Reference Apps Market, By End Use, 2018 - 2030 (USD Million)
Table 42. Italy Medical Reference Apps Market, by Application, 2018 - 2030 (USD Million)
Table 43. Italy Medical Reference Apps Market, by Platform, 2018 - 2030 (USD Million)
Table 44. Italy Medical Reference Apps Market, By Device, 2018 - 2030 (USD Million)
Table 45. Italy Medical Reference Apps Market, By End Use, 2018 - 2030 (USD Million)
Table 46. Spain Medical Reference Apps Market, by Application, 2018 - 2030 (USD Million)
Table 47. Spain Medical Reference Apps Market, by Platform, 2018 - 2030 (USD Million)
Table 48. Spain Medical Reference Apps Market, By Device, 2018 - 2030 (USD Million)
Table 49. Spain Medical Reference Apps Market, By End Use, 2018 - 2030 (USD Million)
Table 50. Denmark Medical Reference Apps Market, by Application, 2018 - 2030 (USD Million)
Table 51. Denmark Medical Reference Apps Market, by Platform, 2018 - 2030 (USD Million)
Table 52. Denmark Medical Reference Apps Market, By Device, 2018 - 2030 (USD Million)
Table 53. Denmark Medical Reference Apps Market, By End Use, 2018 - 2030 (USD Million)
Table 54. Sweden Medical Reference Apps Market, by Application, 2018 - 2030 (USD Million)
Table 55. Sweden Medical Reference Apps Market, by Platform, 2018 - 2030 (USD Million)
Table 56. Sweden Medical Reference Apps Market, By Device, 2018 - 2030 (USD Million)
Table 57. Sweden Medical Reference Apps Market, By End Use, 2018 - 2030 (USD Million)
Table 58. Norway Medical Reference Apps Market, by Application, 2018 - 2030 (USD Million)
Table 59. Norway Medical Reference Apps Market, by Platform, 2018 - 2030 (USD Million)
Table 60. Norway Medical Reference Apps Market, By Device, 2018 - 2030 (USD Million)
Table 61. Norway Medical Reference Apps Market, By End Use, 2018 - 2030 (USD Million)
Table 62. Asia Pacific Medical Reference Apps Market, by Country, 2018 - 2030 (USD Million)
Table 63. Asia Pacific Medical Reference Apps Market, by Application, 2018 - 2030 (USD Million)
Table 64. Asia Pacific Medical Reference Apps Market, by Platform, 2018 - 2030 (USD Million)
Table 65. Asia Pacific Medical Reference Apps Market, By Device, 2018 - 2030 (USD Million)
Table 66. Asia Pacific Medical Reference Apps Market, By End Use, 2018 - 2030 (USD Million)
Table 67. Japan Medical Reference Apps Market, by Application, 2018 - 2030 (USD Million)
Table 68. Japan Medical Reference Apps Market, by Platform, 2018 - 2030 (USD Million)
Table 69. Japan Medical Reference Apps Market, By Device, 2018 - 2030 (USD Million)
Table 70. Japan Medical Reference Apps Market, By End Use, 2018 - 2030 (USD Million)
Table 71. China Medical Reference Apps Market, by Application, 2018 - 2030 (USD Million)
Table 72. China Medical Reference Apps Market, by Platform, 2018 - 2030 (USD Million)
Table 73. China Medical Reference Apps Market, By Device, 2018 - 2030 (USD Million)
Table 74. China Medical Reference Apps Market, By End Use, 2018 - 2030 (USD Million)
Table 75. India Medical Reference Apps Market, by Application, 2018 - 2030 (USD Million)
Table 76. India Medical Reference Apps Market, by Platform, 2018 - 2030 (USD Million)
Table 77. India Medical Reference Apps Market, By Device, 2018 - 2030 (USD Million)
Table 78. India Medical Reference Apps Market, By End Use, 2018 - 2030 (USD Million)
Table 79. Australia Medical Reference Apps Market, by Application, 2018 - 2030 (USD Million)
Table 80. Australia Medical Reference Apps Market, by Platform, 2018 - 2030 (USD Million)
Table 81. Australia Medical Reference Apps Market, By Device, 2018 - 2030 (USD Million)
Table 82. Australia Medical Reference Apps Market, By End Use, 2018 - 2030 (USD Million)
Table 83. Thailand Medical Reference Apps Market, by Application, 2018 - 2030 (USD Million)
Table 84. Thailand Medical Reference Apps Market, by Platform, 2018 - 2030 (USD Million)
Table 85. Thailand Medical Reference Apps Market, By Device, 2018 - 2030 (USD Million)
Table 86. Thailand Medical Reference Apps Market, By End Use, 2018 - 2030 (USD Million)
Table 87. South Korea Medical Reference Apps Market, by Application, 2018 - 2030 (USD Million)
Table 88. South Korea Medical Reference Apps Market, by Platform, 2018 - 2030 (USD Million)
Table 89. South Korea Medical Reference Apps Market, By Device, 2018 - 2030 (USD Million)
Table 90. South Korea Medical Reference Apps Market, By End Use, 2018 - 2030 (USD Million)
Table 91. Latin America Medical Reference Apps Market, by Country, 2018 - 2030 (USD Million)
Table 92. Latin America Medical Reference Apps Market, by Application, 2018 - 2030 (USD Million)
Table 93. Latin America Medical Reference Apps Market, by Platform, 2018 - 2030 (USD Million)
Table 94. Latin America Medical Reference Apps Market, By Device, 2018 - 2030 (USD Million)
Table 95. Latin America Medical Reference Apps Market, By End Use, 2018 - 2030 (USD Million)
Table 96. Brazil Medical Reference Apps Market, by Application, 2018 - 2030 (USD Million)
Table 97. Brazil Medical Reference Apps Market, by Platform, 2018 - 2030 (USD Million)
Table 98. Brazil Medical Reference Apps Market, By Device, 2018 - 2030 (USD Million)
Table 99. Brazil Medical Reference Apps Market, By End Use, 2018 - 2030 (USD Million)
Table 100. Argentina Medical Reference Apps Market, by Application, 2018 - 2030 (USD Million)
Table 101. Argentina Medical Reference Apps Market, by Platform, 2018 - 2030 (USD Million)
Table 102. Argentina Medical Reference Apps Market, By Device, 2018 - 2030 (USD Million)
Table 103. Argentina Medical Reference Apps Market, By End Use, 2018 - 2030 (USD Million)
Table 104. Middle East & Africa Medical Reference Apps Market, by Country, 2018 - 2030 (USD Million)
Table 105. Middle East & Africa Medical Reference Apps Market, by Application, 2018 - 2030 (USD Million)
Table 106. Middle East & Africa Medical Reference Apps Market, by Platform, 2018 - 2030 (USD Million)
Table 107. Middle East & Africa Medical Reference Apps Market, By Device, 2018 - 2030 (USD Million)
Table 108. Middle East & Africa Medical Reference Apps Market, By End Use, 2018 - 2030 (USD Million)
Table 109. South Africa Medical Reference Apps Market, by Application, 2018 - 2030 (USD Million)
Table 110. South Africa Medical Reference Apps Market, by Platform, 2018 - 2030 (USD Million)
Table 111. South Africa Medical Reference Apps Market, By Device, 2018 - 2030 (USD Million)
Table 112. South Africa Medical Reference Apps Market, By End Use, 2018 - 2030 (USD Million)
Table 113. Saudi Arabia Medical Reference Apps Market, by Application, 2018 - 2030 (USD Million)
Table 114. Saudi Arabia Medical Reference Apps Market, by Platform, 2018 - 2030 (USD Million)
Table 115. Saudi Arabia Medical Reference Apps Market, By Device, 2018 - 2030 (USD Million)
Table 116. Saudi Arabia Medical Reference Apps Market, By End Use, 2018 - 2030 (USD Million)
Table 117. UAE Medical Reference Apps Market, by Application, 2018 - 2030 (USD Million)
Table 118. UAE Medical Reference Apps Market, by Platform, 2018 - 2030 (USD Million)
Table 119. UAE Medical Reference Apps Market, By Device, 2018 - 2030 (USD Million)
Table 120. UAE Medical Reference Apps Market, By End Use, 2018 - 2030 (USD Million)
Table 121. Kuwait Medical Reference Apps Market, by Application, 2018 - 2030 (USD Million)
Table 122. Kuwait Medical Reference Apps Market, by Platform, 2018 - 2030 (USD Million)
Table 123. Kuwait Medical Reference Apps Market, By Device, 2018 - 2030 (USD Million)
Table 124. Kuwait Medical Reference Apps Market, By End Use, 2018 - 2030 (USD Million)


List of Figures

Fig. 1 Market research process
Fig. 2 Information procurement
Fig. 3 Primary research pattern
Fig. 4 Market research approaches
Fig. 5 Value chain-based sizing & forecasting
Fig. 6 Market formulation & validation
Fig. 7 Medical Reference Apps market: outlook
Fig. 8 Medical Reference Apps competitive insights
Fig. 9 Ancillary market outlook
Fig. 10 Medical Reference Apps market driver impact
Fig. 11 Medical Reference Apps market restraint impact
Fig. 12 Porter’s Analysis
Fig. 13 PESTLE Analysis
Fig. 14 Medical Reference Apps market: Application movement analysis
Fig. 15 Medical Reference Apps market: Application outlook and key takeaways
Fig. 16 Drug Information market estimates and forecast, 2018 - 2030
Fig. 17 Medical Condition & Symptoms Management market estimates and forecast, 2018 - 2030
Fig. 18 Medical Calculators market estimates and forecast, 2018 - 2030
Fig. 19 Clinical Guidelines market estimates and forecast, 2018 - 2030
Fig. 20 Others market estimates and forecast, 2018 - 2030
Fig. 21 Medical Reference Apps market: Platform movement analysis
Fig. 22 Medical Reference Apps market: Platform outlook and key takeaways
Fig. 23 Android market estimates and forecasts, 2018 - 2030
Fig. 24 iOS market estimates and forecasts, 2018 - 2030
Fig. 25 Others market estimates and forecasts, 2018 - 2030
Fig. 26 Medical Reference Apps market: Device movement analysis
Fig. 27 Medical Reference Apps market: Device outlook and key takeaways
Fig. 28 Smartphones market estimates and forecasts, 2018 - 2030
Fig. 29 Tablets market estimates and forecasts, 2018 - 2030
Fig. 30 Medical Reference Apps market: End Use movement analysis
Fig. 31 Medical Reference Apps market: End Use outlook and key takeaways
Fig. 32 Healthcare Providers market estimates and forecasts, 2018 - 2030
Fig. 33 Patients market estimates and forecasts, 2018 - 2030
Fig. 34 Others market estimates and forecasts, 2018 - 2030
Fig. 35 Global medical reference apps market: Regional movement analysis
Fig. 36 Global medical reference apps market: Regional outlook and key takeaways
Fig. 37 North America medical reference apps market estimates and forecasts, 2018 - 2030 (USD Million)
Fig. 38 Key country dynamics
Fig. 39 US medical reference apps market estimates and forecasts, 2018 - 2030 (USD Million)
Fig. 40 Key country dynamics
Fig. 41 Canada medical reference apps market estimates and forecasts, 2018 - 2030 (USD Million)
Fig. 42 Key country dynamics
Fig. 43 Mexico medical reference apps market estimates and forecasts, 2018 - 2030 (USD Million)
Fig. 44 Europe medical reference apps market estimates and forecasts, 2018 - 2030 (USD Million)
Fig. 45 Key country dynamics
Fig. 46 UK medical reference apps market estimates and forecasts, 2018 - 2030 (USD Million)
Fig. 47 Key country dynamics
Fig. 48 Germany medical reference apps market estimates and forecasts, 2018 - 2030 (USD Million)
Fig. 49 Key country dynamics
Fig. 50 Spain medical reference apps market estimates and forecasts, 2018 - 2030 (USD Million)
Fig. 51 Key country dynamics
Fig. 52 France medical reference apps market estimates and forecasts, 2018 - 2030 (USD Million)
Fig. 53 Key country dynamics
Fig. 54 Italy medical reference apps market estimates and forecasts, 2018 - 2030 (USD Million)
Fig. 55 Key country dynamics
Fig. 56 Norway medical reference apps market estimates and forecasts, 2018 - 2030 (USD Million)
Fig. 57 Key country dynamics
Fig. 58 Denmark medical reference apps market estimates and forecasts, 2018 - 2030 (USD Million)
Fig. 59 Key country dynamics
Fig. 60 Sweden medical reference apps market estimates and forecasts, 2018 - 2030 (USD Million)
Fig. 61 Asia Pacific medical reference apps market estimates and forecasts, 2018 - 2030 (USD Million)
Fig. 62 Key country dynamics
Fig. 63 Japan medical reference apps market estimates and forecasts, 2018 - 2030 (USD Million)
Fig. 64 Key country dynamics
Fig. 65 China medical reference apps market estimates and forecasts, 2018 - 2030 (USD Million)
Fig. 66 Key country dynamics
Fig. 67 India medical reference apps market estimates and forecasts, 2018 - 2030 (USD Million)
Fig. 68 Key country dynamics
Fig. 69 Australia medical reference apps market estimates and forecasts, 2018 - 2030 (USD Million)
Fig. 70 Key country dynamics
Fig. 71 South Korea medical reference apps market estimates and forecasts, 2018 - 2030 (USD Million)
Fig. 72 Key country dynamics
Fig. 73 Thailand medical reference apps market estimates and forecasts, 2018 - 2030 (USD Million)
Fig. 74 Latin America medical reference apps market estimates and forecasts, 2018 - 2030 (USD Million)
Fig. 75 Key country dynamics
Fig. 76 Brazil medical reference apps market estimates and forecasts, 2018 - 2030 (USD Million)
Fig. 77 Key country dynamics
Fig. 78 Argentina medical reference apps market estimates and forecasts, 2018 - 2030 (USD Million)
Fig. 79 MEA medical reference apps market estimates and forecasts, 2018 - 2030 (USD Million)
Fig. 80 Key country dynamics
Fig. 81 South Africa medical reference apps market estimates and forecasts, 2018 - 2030 (USD Million)
Fig. 82 Key country dynamics
Fig. 83 Saudi Arabia medical reference apps market estimates and forecasts, 2018 - 2030 (USD Million)
Fig. 84 Key country dynamics
Fig. 85 UAE medical reference apps market estimates and forecasts, 2018 - 2030 (USD Million)
Fig. 86 Key country dynamics
Fig. 87 Kuwait medical reference apps market estimates and forecasts, 2018 - 2030 (USD Million)
Fig. 88 Key company categorization
Fig. 89 Heat map analysis, 2024

List Tables Figures

Chapter 1. Methodology and Scope
                    1.1. Market Segmentation & Scope
                        1.1.1. Segment scope
                        1.1.2. Regional scope
                        1.1.3. Estimates and forecast timeline
                    1.2. Research Methodology
                    1.3. Information Procurement
                        1.3.1. Purchased database
                        1.3.2. GVR’s internal database
                        1.3.3. Secondary sources
                        1.3.4. Primary research
                        1.3.5. Details of primary research
                    1.4. Information or Data Analysis
                        1.4.1. Data analysis models
                    1.5. Market Formulation & Validation
                    1.6. Model Details
                        1.6.1. Commodity flow analysis (Model 1)
                            1.6.1.1. Approach 1: Commodity flow approach
                    1.7. Research Assumptions
                    1.8. List of Secondary Sources
                    1.9. List of Primary Sources
Chapter 2. Executive Summary
                    2.1. Market Outlook
                    2.2. Segment Outlook
                        2.2.1. Application outlook
                        2.2.2. Platform outlook
                        2.2.3. Device outlook
                        2.2.4. Regional outlook
                    2.3. Competitive Insights
Chapter 3. Medical Reference Apps Market Variables, Trends & Scope
                    3.1. Market Lineage Outlook
                        3.1.1. Parent market outlook
                        3.1.2. Ancillary market outlook
                    3.2. Market Dynamics
                        3.2.1. Market driver analysis
                        3.2.2. Market restraint analysis
                    3.3. Medical Reference Apps: Market Analysis Tools
                        3.3.1. Industry Analysis - Porter’s Five Forces Analysis
                            3.3.1.1. Supplier Power
                            3.3.1.2. Buyer Power
                            3.3.1.3. Substitution Threat
                            3.3.1.4. Threat of New Entrants
                            3.3.1.5. Competitive Rivalry
                        3.3.2. PESTLE Analysis
                    3.4. Regulatory Landscape
                    3.5. Medical Reference Apps Market Ecosystem
                    3.6. Medical Reference Apps Market Key Evaluation Metrix (active users, retention rate, conversion rate)
                    3.7. Digital Health Market Ecosystem
                    3.8. Digital Health Market Funding Scenario
                    3.9. Technology Landscape
                    3.10. Case Study Analysis
Chapter 4. Medical Reference Apps Market Segment Analysis, By Application, 2018 - 2030 (USD Million)
                    4.1. Definition and Scope
                    4.2. Application Market Share Analysis, 2024 & 2030
                    4.3. Segment Dashboard
                    4.4. Global Medical Reference Apps Market, by Application, 2018 to 2030
                    4.5. Drug Information
                        4.5.1. Drug Information Market Revenue Estimates and Forecasts, 2018 - 2030 (USD Million)
                    4.6. Medical Condition & Symptoms Management
                        4.6.1. Medical Condition & Symptoms Management Market Revenue Estimates and Forecasts, 2018 - 2030 (USD Million)
                    4.7. Medical Calculators
                        4.7.1. Medical Calculators Market Revenue Estimates and Forecasts, 2018 - 2030 (USD Million)
                    4.8. Clinical Guidelines
                        4.8.1. Clinical Guidelines Market Revenue Estimates and Forecasts, 2018 - 2030 (USD Million)
                    4.9. Others
                        4.9.1. Others Market Revenue Estimates and Forecasts, 2018 - 2030 (USD Million)
Chapter 5. Medical Reference Apps Market Segment Analysis, By Platform, 2018 - 2030 (USD Million)
                    5.1. Definition and Scope
                    5.2. Platform Market Share Analysis, 2024 & 2030
                    5.3. Segment Dashboard
                    5.4. Global Medical Reference Apps Market, by Platform, 2018 to 2030
                    5.5. Android
                        5.5.1. Android Market Revenue Estimates and Forecasts, 2018 - 2030 (USD Million)
                    5.6. iOS
                        5.6.1. iOS Market Revenue Estimates and Forecasts, 2018 - 2030 (USD Million)
                    5.7. Others
                        5.7.1. Others Market Revenue Estimates and Forecasts, 2018 - 2030 (USD Million)
Chapter 6. Medical Reference Apps Market Segment Analysis, By Device, 2018 - 2030 (USD Million)
                    6.1. Definition and Scope
                    6.2. Device Market Share Analysis, 2024 & 2030
                    6.3. Segment Dashboard
                    6.4. Global Medical Reference Apps Market, by Device, 2018 to 2030
                    6.5. Smartphones
                        6.5.1. Smartphones Market Revenue Estimates and Forecasts, 2018 - 2030 (USD Million)
                    6.6. Tablets
                        6.6.1. Tablets Market Revenue Estimates and Forecasts, 2018 - 2030 (USD Million)
Chapter 7. Medical Reference Apps Market Segment Analysis, By End Use, 2018 - 2030 (USD Million)
                    7.1. Definition and Scope
                    7.2. End Use Market Share Analysis, 2024 & 2030
                    7.3. Segment Dashboard
                    7.4. Global Medical Reference Apps Market, by End Use, 2018 to 2030
                    7.5. Healthcare Providers
                        7.5.1. Healthcare Providers Market Revenue Estimates and Forecasts, 2018 - 2030 (USD Million)
                    7.6. Patients
                        7.6.1. Patients Market Revenue Estimates and Forecasts, 2018 - 2030 (USD Million)
                    7.7. Others
                        7.7.1. Others Market Revenue Estimates and Forecasts, 2018 - 2030 (USD Million)
Chapter 8. Medical Reference Apps Market Segment Analysis, By Region, 2018- 2030 (USD Million)
                    8.1. Regional Market Share Analysis, 2024 & 2030
                    8.2. Regional Market Dashboard
                    8.3. Regional Market Snapshot
                    8.4. Medical Reference Apps Market Share by Region, 2024 & 2030:
                    8.5. North America
                        8.5.1. North America medical reference apps market, 2018 - 2030 (USD Million)
                        8.5.2. U.S.
                            8.5.2.1. Key Country Dynamics
                            8.5.2.2. Regulatory Scenario
                            8.5.2.3. Competitive Scenario
                            8.5.2.4. U.S. medical reference apps market, 2018 - 2030 (USD Million)
                        8.5.3. Canada
                            8.5.3.1. Key Country Dynamics
                            8.5.3.2. Regulatory Scenario
                            8.5.3.3. Competitive Scenario
                            8.5.3.4. Canada medical reference apps market, 2018 - 2030 (USD Million)
                        8.5.4. Mexico
                            8.5.4.1. Key Country Dynamics
                            8.5.4.2. Regulatory Scenario
                            8.5.4.3. Competitive Scenario
                            8.5.4.4. Mexico medical reference apps market, 2018 - 2030 (USD Million)
                    8.6. Europe
                        8.6.1. Europe medical reference apps market, 2018 - 2030 (USD Million)
                        8.6.2. UK
                            8.6.2.1. Key Country Dynamics
                            8.6.2.2. Regulatory Scenario
                            8.6.2.3. Competitive Scenario
                            8.6.2.4. UK medical reference apps market, 2018 - 2030 (USD Million)
                        8.6.3. Germany
                            8.6.3.1. Key Country Dynamics
                            8.6.3.2. Regulatory Scenario
                            8.6.3.3. Competitive Scenario
                            8.6.3.4. Germany medical reference apps market, 2018 - 2030 (USD Million)
                        8.6.4. France
                            8.6.4.1. Key Country Dynamics
                            8.6.4.2. Regulatory Scenario
                            8.6.4.3. Competitive Scenario
                            8.6.4.4. France medical reference apps market, 2018 - 2030 (USD Million)
                        8.6.5. Italy
                            8.6.5.1. Key Country Dynamics
                            8.6.5.2. Regulatory Scenario
                            8.6.5.3. Competitive Scenario
                            8.6.5.4. Italy medical reference apps market, 2018 - 2030 (USD Million)
                        8.6.6. Spain
                            8.6.6.1. Key Country Dynamics
                            8.6.6.2. Regulatory Scenario
                            8.6.6.3. Competitive Scenario
                            8.6.6.4. Spain medical reference apps market, 2018 - 2030 (USD Million)
                        8.6.7. Norway
                            8.6.7.1. Key Country Dynamics
                            8.6.7.2. Regulatory Scenario
                            8.6.7.3. Competitive Scenario
                            8.6.7.4. Norway medical reference apps market, 2018 - 2030 (USD Million)
                        8.6.8. Sweden
                            8.6.8.1. Key Country Dynamics
                            8.6.8.2. Regulatory Scenario
                            8.6.8.3. Competitive Scenario
                            8.6.8.4. Sweden medical reference apps market, 2018 - 2030 (USD Million)
                        8.6.9. Denmark
                            8.6.9.1. Key Country Dynamics
                            8.6.9.2. Regulatory Scenario
                            8.6.9.3. Competitive Scenario
                            8.6.9.4. Denmark medical reference apps market, 2018 - 2030 (USD Million)
                    8.7. Asia Pacific
                        8.7.1. Japan
                            8.7.1.1. Key Country Dynamics
                            8.7.1.2. Regulatory Scenario
                            8.7.1.3. Competitive Scenario
                            8.7.1.4. Japan medical reference apps market, 2018 - 2030 (USD Million)
                        8.7.2. China
                            8.7.2.1. Key Country Dynamics
                            8.7.2.2. Regulatory Scenario
                            8.7.2.3. Competitive Scenario
                            8.7.2.4. China medical reference apps market, 2018 - 2030 (USD Million)
                        8.7.3. India
                            8.7.3.1. Key Country Dynamics
                            8.7.3.2. Regulatory Scenario
                            8.7.3.3. Competitive Scenario
                            8.7.3.4. India medical reference apps market, 2018 - 2030 (USD Million)
                        8.7.4. Australia
                            8.7.4.1. Key Country Dynamics
                            8.7.4.2. Regulatory Scenario
                            8.7.4.3. Competitive Scenario
                            8.7.4.4. Australia medical reference apps market, 2018 - 2030 (USD Million)
                        8.7.5. South Korea
                            8.7.5.1. Key Country Dynamics
                            8.7.5.2. Regulatory Scenario
                            8.7.5.3. Competitive Scenario
                            8.7.5.4. South Korea medical reference apps market, 2018 - 2030 (USD Million)
                        8.7.6. Thailand
                            8.7.6.1. Key Country Dynamics
                            8.7.6.2. Regulatory Scenario
                            8.7.6.3. Competitive Scenario
                            8.7.6.4. Thailand medical reference apps market, 2018 - 2030 (USD Million)
                    8.8. Latin America
                        8.8.1. Brazil
                            8.8.1.1. Key Country Dynamics
                            8.8.1.2. Regulatory Scenario
                            8.8.1.3. Competitive Scenario
                            8.8.1.4. Brazil medical reference apps market, 2018 - 2030 (USD Million)
                        8.8.2. Argentina
                            8.8.2.1. Key Country Dynamics
                            8.8.2.2. Regulatory Scenario
                            8.8.2.3. Competitive Scenario
                            8.8.2.4. Argentina medical reference apps market, 2018 - 2030 (USD Million)
                    8.9. MEA
                        8.9.1. South Africa
                            8.9.1.1. Key Country Dynamics
                            8.9.1.2. Regulatory Scenario
                            8.9.1.3. Competitive Scenario
                            8.9.1.4. South Africa medical reference apps market, 2018 - 2030 (USD Million)
                        8.9.2. Saudi Arabia
                            8.9.2.1. Key Country Dynamics
                            8.9.2.2. Regulatory Scenario
                            8.9.2.3. Competitive Scenario
                            8.9.2.4. Saudi Arabia medical reference apps market, 2018 - 2030 (USD Million)
                        8.9.3. UAE
                            8.9.3.1. Key Country Dynamics
                            8.9.3.2. Regulatory Scenario
                            8.9.3.3. Competitive Scenario
                            8.9.3.4. UAE medical reference apps market, 2018 - 2030 (USD Million)
                        8.9.4. Kuwait
                            8.9.4.1. Key Country Dynamics
                            8.9.4.2. Regulatory Scenario
                            8.9.4.3. Competitive Scenario
                            8.9.4.4. Kuwait medical reference apps market, 2018 - 2030 (USD Million)
Chapter 9. Competitive Landscape
                    9.1. Recent Developments & Impact Analysis, By Key Market Participants
                    9.2. Company Categorization
                    9.3. Company Profiles
                        9.3.1. Medscape
                            9.3.1.1. Company overview
                            9.3.1.2. Financial performance
                            9.3.1.3. Platform benchmarking
                            9.3.1.4. Strategic initiatives
                        9.3.2. Epocrates
                            9.3.2.1. Company overview
                            9.3.2.2. Financial performance
                            9.3.2.3. Platform benchmarking
                            9.3.2.4. Strategic initiatives
                        9.3.3. DynaMed Plus
                            9.3.3.1. Company overview
                            9.3.3.2. Financial performance
                            9.3.3.3. Platform benchmarking
                            9.3.3.4. Strategic initiatives
                        9.3.4. UpToDate Lexidrug (formerly Lexicomp)
                            9.3.4.1. Company overview
                            9.3.4.2. Financial performance
                            9.3.4.3. Platform benchmarking
                            9.3.4.4. Strategic initiatives
                        9.3.5. VisualDX
                            9.3.5.1. Company overview
                            9.3.5.2. Financial performance
                            9.3.5.3. Platform benchmarking
                            9.3.5.4. Strategic initiatives
                        9.3.6. Micromedex (Merative US L.P.)
                            9.3.6.1. Company overview
                            9.3.6.2. Financial performance
                            9.3.6.3. Platform benchmarking
                            9.3.6.4. Strategic initiatives
                        9.3.7. Figure 1
                            9.3.7.1. Company overview
                            9.3.7.2. Financial performance
                            9.3.7.3. Platform benchmarking
                            9.3.7.4. Strategic initiatives
                        9.3.8. QxMD Read
                            9.3.8.1. Company overview
                            9.3.8.2. Financial performance
                            9.3.8.3. Platform benchmarking
                            9.3.8.4. Strategic initiatives
                        9.3.9. Skyscape Medical Library
                            9.3.9.1. Company overview
                            9.3.9.2. Financial performance
                            9.3.9.3. Platform benchmarking
                            9.3.9.4. Strategic initiatives
                        9.3.10. MedlinePlus
                            9.3.10.1. Company overview
                            9.3.10.2. Financial performance
                            9.3.10.3. Platform benchmarking
                            9.3.10.4. Strategic initiatives


List of Tables

Table 1. List of secondary sources
Table 2. List of abbreviations
Table 3. Global Medical Reference Apps Market, By Application, 2018 - 2030 (USD Million)
Table 4. Global Medical Reference Apps Market, By Platform, 2018 - 2030 (USD Million)
Table 5. Global Medical Reference Apps Market, By Device, 2018 - 2030 (USD Million)
Table 6. Global Medical Reference Apps Market, By End Use, 2018 - 2030 (USD Million)
Table 7. Global Medical Reference Apps Market, By Region, 2018 - 2030 (USD Million)
Table 8. North America Medical Reference Apps Market, By Country, 2018 - 2030 (USD Million)
Table 9. North America Medical Reference Apps Market, By Application, 2018 - 2030 (USD Million)
Table 10. North America Medical Reference Apps Market, By Platform, 2018 - 2030 (USD Million)
Table 11. North America Medical Reference Apps Market, By Device, 2018 - 2030 (USD Million)
Table 12. North America Medical Reference Apps Market, By End Use, 2018 - 2030 (USD Million)
Table 13. U.S. Medical Reference Apps Market, by Application, 2018 - 2030 (USD Million)
Table 14. U.S. Medical Reference Apps Market, By Platform, 2018 - 2030 (USD Million)
Table 15. U.S. Medical Reference Apps Market, By Device, 2018 - 2030 (USD Million)
Table 16. U.S. Medical Reference Apps Market, By End Use, 2018 - 2030 (USD Million)
Table 17. Canada Medical Reference Apps Market, by Application, 2018 - 2030 (USD Million)
Table 18. Canada Medical Reference Apps Market, By Platform, 2018 - 2030 (USD Million)
Table 19. Canada Medical Reference Apps Market, By Device, 2018 - 2030 (USD Million)
Table 20. Canada Medical Reference Apps Market, By End Use, 2018 - 2030 (USD Million)
Table 21. Mexico Medical Reference Apps Market, by Application, 2018 - 2030 (USD Million)
Table 22. Mexico Medical Reference Apps Market, by Platform, 2018 - 2030 (USD Million)
Table 23. Mexico Medical Reference Apps Market, By Device, 2018 - 2030 (USD Million)
Table 24. Mexico Medical Reference Apps Market, By End Use, 2018 - 2030 (USD Million)
Table 25. Europe Medical Reference Apps Market, by Country, 2018 - 2030 (USD Million)
Table 26. Europe Medical Reference Apps Market, by Application, 2018 - 2030 (USD Million)
Table 27. Europe Medical Reference Apps Market, By Platform, 2018 - 2030 (USD Million)
Table 28. Europe Medical Reference Apps Market, By Device, 2018 - 2030 (USD Million)
Table 29. Europe Medical Reference Apps Market, By End Use, 2018 - 2030 (USD Million)
Table 30. UK Medical Reference Apps Market, by Application, 2018 - 2030 (USD Million)
Table 31. UK Medical Reference Apps Market, By Platform, 2018 - 2030 (USD Million)
Table 32. UK Medical Reference Apps Market, By Device, 2018 - 2030 (USD Million)
Table 33. UK Medical Reference Apps Market, By End Use, 2018 - 2030 (USD Million)
Table 34. Germany Medical Reference Apps Market, by Application, 2018 - 2030 (USD Million)
Table 35. Germany Medical Reference Apps Market, by Platform, 2018 - 2030 (USD Million)
Table 36. Germany Medical Reference Apps Market, By Device, 2018 - 2030 (USD Million)
Table 37. Germany Medical Reference Apps Market, By End Use, 2018 - 2030 (USD Million)
Table 38. France Medical Reference Apps Market, by Application, 2018 - 2030 (USD Million)
Table 39. France Medical Reference Apps Market, by Platform, 2018 - 2030 (USD Million)
Table 40. France Medical Reference Apps Market, By Device, 2018 - 2030 (USD Million)
Table 41. France Medical Reference Apps Market, By End Use, 2018 - 2030 (USD Million)
Table 42. Italy Medical Reference Apps Market, by Application, 2018 - 2030 (USD Million)
Table 43. Italy Medical Reference Apps Market, by Platform, 2018 - 2030 (USD Million)
Table 44. Italy Medical Reference Apps Market, By Device, 2018 - 2030 (USD Million)
Table 45. Italy Medical Reference Apps Market, By End Use, 2018 - 2030 (USD Million)
Table 46. Spain Medical Reference Apps Market, by Application, 2018 - 2030 (USD Million)
Table 47. Spain Medical Reference Apps Market, by Platform, 2018 - 2030 (USD Million)
Table 48. Spain Medical Reference Apps Market, By Device, 2018 - 2030 (USD Million)
Table 49. Spain Medical Reference Apps Market, By End Use, 2018 - 2030 (USD Million)
Table 50. Denmark Medical Reference Apps Market, by Application, 2018 - 2030 (USD Million)
Table 51. Denmark Medical Reference Apps Market, by Platform, 2018 - 2030 (USD Million)
Table 52. Denmark Medical Reference Apps Market, By Device, 2018 - 2030 (USD Million)
Table 53. Denmark Medical Reference Apps Market, By End Use, 2018 - 2030 (USD Million)
Table 54. Sweden Medical Reference Apps Market, by Application, 2018 - 2030 (USD Million)
Table 55. Sweden Medical Reference Apps Market, by Platform, 2018 - 2030 (USD Million)
Table 56. Sweden Medical Reference Apps Market, By Device, 2018 - 2030 (USD Million)
Table 57. Sweden Medical Reference Apps Market, By End Use, 2018 - 2030 (USD Million)
Table 58. Norway Medical Reference Apps Market, by Application, 2018 - 2030 (USD Million)
Table 59. Norway Medical Reference Apps Market, by Platform, 2018 - 2030 (USD Million)
Table 60. Norway Medical Reference Apps Market, By Device, 2018 - 2030 (USD Million)
Table 61. Norway Medical Reference Apps Market, By End Use, 2018 - 2030 (USD Million)
Table 62. Asia Pacific Medical Reference Apps Market, by Country, 2018 - 2030 (USD Million)
Table 63. Asia Pacific Medical Reference Apps Market, by Application, 2018 - 2030 (USD Million)
Table 64. Asia Pacific Medical Reference Apps Market, by Platform, 2018 - 2030 (USD Million)
Table 65. Asia Pacific Medical Reference Apps Market, By Device, 2018 - 2030 (USD Million)
Table 66. Asia Pacific Medical Reference Apps Market, By End Use, 2018 - 2030 (USD Million)
Table 67. Japan Medical Reference Apps Market, by Application, 2018 - 2030 (USD Million)
Table 68. Japan Medical Reference Apps Market, by Platform, 2018 - 2030 (USD Million)
Table 69. Japan Medical Reference Apps Market, By Device, 2018 - 2030 (USD Million)
Table 70. Japan Medical Reference Apps Market, By End Use, 2018 - 2030 (USD Million)
Table 71. China Medical Reference Apps Market, by Application, 2018 - 2030 (USD Million)
Table 72. China Medical Reference Apps Market, by Platform, 2018 - 2030 (USD Million)
Table 73. China Medical Reference Apps Market, By Device, 2018 - 2030 (USD Million)
Table 74. China Medical Reference Apps Market, By End Use, 2018 - 2030 (USD Million)
Table 75. India Medical Reference Apps Market, by Application, 2018 - 2030 (USD Million)
Table 76. India Medical Reference Apps Market, by Platform, 2018 - 2030 (USD Million)
Table 77. India Medical Reference Apps Market, By Device, 2018 - 2030 (USD Million)
Table 78. India Medical Reference Apps Market, By End Use, 2018 - 2030 (USD Million)
Table 79. Australia Medical Reference Apps Market, by Application, 2018 - 2030 (USD Million)
Table 80. Australia Medical Reference Apps Market, by Platform, 2018 - 2030 (USD Million)
Table 81. Australia Medical Reference Apps Market, By Device, 2018 - 2030 (USD Million)
Table 82. Australia Medical Reference Apps Market, By End Use, 2018 - 2030 (USD Million)
Table 83. Thailand Medical Reference Apps Market, by Application, 2018 - 2030 (USD Million)
Table 84. Thailand Medical Reference Apps Market, by Platform, 2018 - 2030 (USD Million)
Table 85. Thailand Medical Reference Apps Market, By Device, 2018 - 2030 (USD Million)
Table 86. Thailand Medical Reference Apps Market, By End Use, 2018 - 2030 (USD Million)
Table 87. South Korea Medical Reference Apps Market, by Application, 2018 - 2030 (USD Million)
Table 88. South Korea Medical Reference Apps Market, by Platform, 2018 - 2030 (USD Million)
Table 89. South Korea Medical Reference Apps Market, By Device, 2018 - 2030 (USD Million)
Table 90. South Korea Medical Reference Apps Market, By End Use, 2018 - 2030 (USD Million)
Table 91. Latin America Medical Reference Apps Market, by Country, 2018 - 2030 (USD Million)
Table 92. Latin America Medical Reference Apps Market, by Application, 2018 - 2030 (USD Million)
Table 93. Latin America Medical Reference Apps Market, by Platform, 2018 - 2030 (USD Million)
Table 94. Latin America Medical Reference Apps Market, By Device, 2018 - 2030 (USD Million)
Table 95. Latin America Medical Reference Apps Market, By End Use, 2018 - 2030 (USD Million)
Table 96. Brazil Medical Reference Apps Market, by Application, 2018 - 2030 (USD Million)
Table 97. Brazil Medical Reference Apps Market, by Platform, 2018 - 2030 (USD Million)
Table 98. Brazil Medical Reference Apps Market, By Device, 2018 - 2030 (USD Million)
Table 99. Brazil Medical Reference Apps Market, By End Use, 2018 - 2030 (USD Million)
Table 100. Argentina Medical Reference Apps Market, by Application, 2018 - 2030 (USD Million)
Table 101. Argentina Medical Reference Apps Market, by Platform, 2018 - 2030 (USD Million)
Table 102. Argentina Medical Reference Apps Market, By Device, 2018 - 2030 (USD Million)
Table 103. Argentina Medical Reference Apps Market, By End Use, 2018 - 2030 (USD Million)
Table 104. Middle East & Africa Medical Reference Apps Market, by Country, 2018 - 2030 (USD Million)
Table 105. Middle East & Africa Medical Reference Apps Market, by Application, 2018 - 2030 (USD Million)
Table 106. Middle East & Africa Medical Reference Apps Market, by Platform, 2018 - 2030 (USD Million)
Table 107. Middle East & Africa Medical Reference Apps Market, By Device, 2018 - 2030 (USD Million)
Table 108. Middle East & Africa Medical Reference Apps Market, By End Use, 2018 - 2030 (USD Million)
Table 109. South Africa Medical Reference Apps Market, by Application, 2018 - 2030 (USD Million)
Table 110. South Africa Medical Reference Apps Market, by Platform, 2018 - 2030 (USD Million)
Table 111. South Africa Medical Reference Apps Market, By Device, 2018 - 2030 (USD Million)
Table 112. South Africa Medical Reference Apps Market, By End Use, 2018 - 2030 (USD Million)
Table 113. Saudi Arabia Medical Reference Apps Market, by Application, 2018 - 2030 (USD Million)
Table 114. Saudi Arabia Medical Reference Apps Market, by Platform, 2018 - 2030 (USD Million)
Table 115. Saudi Arabia Medical Reference Apps Market, By Device, 2018 - 2030 (USD Million)
Table 116. Saudi Arabia Medical Reference Apps Market, By End Use, 2018 - 2030 (USD Million)
Table 117. UAE Medical Reference Apps Market, by Application, 2018 - 2030 (USD Million)
Table 118. UAE Medical Reference Apps Market, by Platform, 2018 - 2030 (USD Million)
Table 119. UAE Medical Reference Apps Market, By Device, 2018 - 2030 (USD Million)
Table 120. UAE Medical Reference Apps Market, By End Use, 2018 - 2030 (USD Million)
Table 121. Kuwait Medical Reference Apps Market, by Application, 2018 - 2030 (USD Million)
Table 122. Kuwait Medical Reference Apps Market, by Platform, 2018 - 2030 (USD Million)
Table 123. Kuwait Medical Reference Apps Market, By Device, 2018 - 2030 (USD Million)
Table 124. Kuwait Medical Reference Apps Market, By End Use, 2018 - 2030 (USD Million)


List of Figures

Fig. 1 Market research process
Fig. 2 Information procurement
Fig. 3 Primary research pattern
Fig. 4 Market research approaches
Fig. 5 Value chain-based sizing & forecasting
Fig. 6 Market formulation & validation
Fig. 7 Medical Reference Apps market: outlook
Fig. 8 Medical Reference Apps competitive insights
Fig. 9 Ancillary market outlook
Fig. 10 Medical Reference Apps market driver impact
Fig. 11 Medical Reference Apps market restraint impact
Fig. 12 Porter’s Analysis
Fig. 13 PESTLE Analysis
Fig. 14 Medical Reference Apps market: Application movement analysis
Fig. 15 Medical Reference Apps market: Application outlook and key takeaways
Fig. 16 Drug Information market estimates and forecast, 2018 - 2030
Fig. 17 Medical Condition & Symptoms Management market estimates and forecast, 2018 - 2030
Fig. 18 Medical Calculators market estimates and forecast, 2018 - 2030
Fig. 19 Clinical Guidelines market estimates and forecast, 2018 - 2030
Fig. 20 Others market estimates and forecast, 2018 - 2030
Fig. 21 Medical Reference Apps market: Platform movement analysis
Fig. 22 Medical Reference Apps market: Platform outlook and key takeaways
Fig. 23 Android market estimates and forecasts, 2018 - 2030
Fig. 24 iOS market estimates and forecasts, 2018 - 2030
Fig. 25 Others market estimates and forecasts, 2018 - 2030
Fig. 26 Medical Reference Apps market: Device movement analysis
Fig. 27 Medical Reference Apps market: Device outlook and key takeaways
Fig. 28 Smartphones market estimates and forecasts, 2018 - 2030
Fig. 29 Tablets market estimates and forecasts, 2018 - 2030
Fig. 30 Medical Reference Apps market: End Use movement analysis
Fig. 31 Medical Reference Apps market: End Use outlook and key takeaways
Fig. 32 Healthcare Providers market estimates and forecasts, 2018 - 2030
Fig. 33 Patients market estimates and forecasts, 2018 - 2030
Fig. 34 Others market estimates and forecasts, 2018 - 2030
Fig. 35 Global medical reference apps market: Regional movement analysis
Fig. 36 Global medical reference apps market: Regional outlook and key takeaways
Fig. 37 North America medical reference apps market estimates and forecasts, 2018 - 2030 (USD Million)
Fig. 38 Key country dynamics
Fig. 39 US medical reference apps market estimates and forecasts, 2018 - 2030 (USD Million)
Fig. 40 Key country dynamics
Fig. 41 Canada medical reference apps market estimates and forecasts, 2018 - 2030 (USD Million)
Fig. 42 Key country dynamics
Fig. 43 Mexico medical reference apps market estimates and forecasts, 2018 - 2030 (USD Million)
Fig. 44 Europe medical reference apps market estimates and forecasts, 2018 - 2030 (USD Million)
Fig. 45 Key country dynamics
Fig. 46 UK medical reference apps market estimates and forecasts, 2018 - 2030 (USD Million)
Fig. 47 Key country dynamics
Fig. 48 Germany medical reference apps market estimates and forecasts, 2018 - 2030 (USD Million)
Fig. 49 Key country dynamics
Fig. 50 Spain medical reference apps market estimates and forecasts, 2018 - 2030 (USD Million)
Fig. 51 Key country dynamics
Fig. 52 France medical reference apps market estimates and forecasts, 2018 - 2030 (USD Million)
Fig. 53 Key country dynamics
Fig. 54 Italy medical reference apps market estimates and forecasts, 2018 - 2030 (USD Million)
Fig. 55 Key country dynamics
Fig. 56 Norway medical reference apps market estimates and forecasts, 2018 - 2030 (USD Million)
Fig. 57 Key country dynamics
Fig. 58 Denmark medical reference apps market estimates and forecasts, 2018 - 2030 (USD Million)
Fig. 59 Key country dynamics
Fig. 60 Sweden medical reference apps market estimates and forecasts, 2018 - 2030 (USD Million)
Fig. 61 Asia Pacific medical reference apps market estimates and forecasts, 2018 - 2030 (USD Million)
Fig. 62 Key country dynamics
Fig. 63 Japan medical reference apps market estimates and forecasts, 2018 - 2030 (USD Million)
Fig. 64 Key country dynamics
Fig. 65 China medical reference apps market estimates and forecasts, 2018 - 2030 (USD Million)
Fig. 66 Key country dynamics
Fig. 67 India medical reference apps market estimates and forecasts, 2018 - 2030 (USD Million)
Fig. 68 Key country dynamics
Fig. 69 Australia medical reference apps market estimates and forecasts, 2018 - 2030 (USD Million)
Fig. 70 Key country dynamics
Fig. 71 South Korea medical reference apps market estimates and forecasts, 2018 - 2030 (USD Million)
Fig. 72 Key country dynamics
Fig. 73 Thailand medical reference apps market estimates and forecasts, 2018 - 2030 (USD Million)
Fig. 74 Latin America medical reference apps market estimates and forecasts, 2018 - 2030 (USD Million)
Fig. 75 Key country dynamics
Fig. 76 Brazil medical reference apps market estimates and forecasts, 2018 - 2030 (USD Million)
Fig. 77 Key country dynamics
Fig. 78 Argentina medical reference apps market estimates and forecasts, 2018 - 2030 (USD Million)
Fig. 79 MEA medical reference apps market estimates and forecasts, 2018 - 2030 (USD Million)
Fig. 80 Key country dynamics
Fig. 81 South Africa medical reference apps market estimates and forecasts, 2018 - 2030 (USD Million)
Fig. 82 Key country dynamics
Fig. 83 Saudi Arabia medical reference apps market estimates and forecasts, 2018 - 2030 (USD Million)
Fig. 84 Key country dynamics
Fig. 85 UAE medical reference apps market estimates and forecasts, 2018 - 2030 (USD Million)
Fig. 86 Key country dynamics
Fig. 87 Kuwait medical reference apps market estimates and forecasts, 2018 - 2030 (USD Million)
Fig. 88 Key company categorization
Fig. 89 Heat map analysis, 2024

FAQ'S

For a single, multi and corporate client license, the report will be available in PDF format. Sample report would be given you in excel format. For more questions please contact:

sales@marketinsightsresearch.com

Within 24 to 48 hrs.

You can contact Sales team (sales@marketinsightsresearch.com) and they will direct you on email

You can order a report by selecting payment methods, which is bank wire or online payment through any Debit/Credit card, Razor pay or PayPal.