Bicycle Sharing Market Size, Share & Trends Analysis Report By Type (E-bike, Classic Bike), By Payment Method (Pay-as-you-go, Subscription Based), By Service (Docked, Dockless), By Region, And Segment Forecasts
Published Date: April - 2025 | Publisher: MIR | No of Pages: 260 | Industry: consumer and goods | Format: Report available in PDF / Excel Format
View Details Buy Now 2999 Download Free Sample Ask for Discount Request CustomizationBicycle Sharing Market Size & Trends
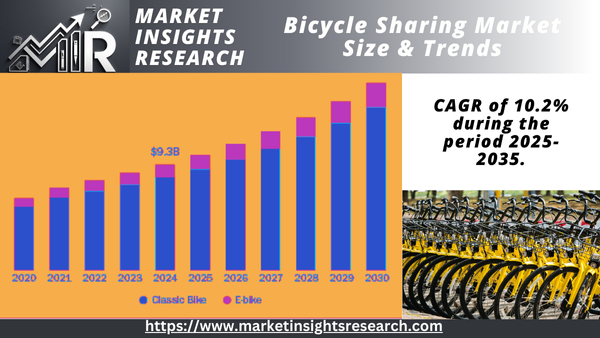
The size of the global bicycle sharing market was valued at USD 9.26 billion in 2024 and is expected to grow at a CAGR of 10.2% during the period 2025-2035.
The growth in the market is driven by growing awareness of environmental sustainability among urban dwellers. As cities worldwide struggle with pollution and congestion, governments and communities are actively encouraging bicycle-sharing as an eco-friendly mode of transport compared to motorized transport. This initiative is part of larger climate change mitigation efforts that promote environmentally friendly means of transport to minimize energy use and carbon prints.
Mass urbanization has worsened traffic in cities, and this has forced the government to encourage the use of alternative transport. Cycling sharing programs provide a versatile, last-mile transport solution that augments mass transit. In Paris, the Vélib' bicycle-sharing system is thoughtfully aligned with metro and bus lines, radically diminishing private vehicle dependency and traffic on roads.
Increasing knowledge of climate change and carbon emissions of traditional transport modes have speeded the use of low-emission mobility options. The use of bike sharing reduces the emissions of greenhouse gases, reflecting worldwide climate measures like the European Green Deal. Leading cities of Copenhagen and Amsterdam, pioneering eco-mobility in urban development, have incorporated shared bicycles within larger eco-mobility frameworks.
Government support in the public sector, such as subsidies, public-private partnerships, and infrastructure development, is driving the growth of bicycle sharing programs. For example, the Smart Cities Mission by the Indian government has encouraged some Tier 1 and Tier 2 cities to adopt integrated bike-sharing systems under smart urban mobility plans.
Technological developments-including GPS tracking, app-enabled access, IoT-supported fleet management, and dynamic pricing algorithms-have greatly improved the user experience, operational efficiency, and scalability of bike share platforms. Firms such as Lime and Mobike have rolled out dockless models that allow real-time location of bikes and instant rental through mobile applications, thus increasing access and use.
The increase in urbanization and population has forced the need for effective transport systems, especially in densely populated cities. Bike-sharing presents a cost- and time-effective solution for last-mile connectivity, meeting the demands of commuters who need short-distance travel modes to augment public transport networks such as buses and trains. This ease of access and convenience have increased the popularity of bike-sharing schemes.
Technological innovation in bicycle-sharing systems has also been instrumental in propelling market growth. The introduction of GPS monitoring, online mobile applications for easy bike rentals, and integration with dockless systems has improved user convenience and operational effectiveness. These innovations have rendered bicycle-sharing more convenient and accessible, paving the way for extensive uptake.
In addition, health-aware consumers are increasingly opting for cycling as a means of transportation, appreciating its physical health benefits. The trend towards active transport is also part of a larger lifestyle shift towards fitness and health, which further fuels the demand for bicycle-sharing services. At the same time, the cost-effectiveness of shared bicycles over personal cars or ride-sharing services makes them an economically viable choice, particularly among students and low-income populations.
Government support policies and investments in infrastructure, including exclusive bike lanes and parking facilities, are driving the expansion of this market. Public-private partnerships and subsidies for bike-sharing firms are encouraging the development of these services, making them available and accessible to various user segments.
For instance, in India, cities such as Ahmedabad, Indore, Kochi, Mysuru, Bhopal, and Chandigarh have embraced Public Bike Sharing (PBS) systems. These initiatives are supported by policies such as the National Urban Transport Policy (NUTP) and the Smart City Mission, which emphasize the development of Non-Motorized Transport (NMT) infrastructure.
Report Coverage & Deliverables
PDF report & online dashboard will help you understand
- Competitive benchmarking
- Historical data & forecasts
- Company revenue shares
- Regional opportunities
- Latest trends & dynamics
Consumer Survey & Insights
Cycling Industries Europe (CIE), a trade association of a group of cycling companies in the EU, releases a benchmarking report on bike-sharing schemes operating in almost 148 European cities. In the recent one, the benchmark for daily bike-sharing trips, trips per 1000 inhabitants, ranks the high-performing cities. Paris (36.9), Bordeaux, Antwerp (36.1), Toulouse (19.8), and Lyon dominated in 2022. In 2023, the two new members in the Top 5 were new entrants Ljubljana (26.0) and Tartu (20.4), retaining a barrier of more than 19 trips per 1000 residents. The data emphasizes increasing influence of bicycle sharing in European city mobility.
Type Insights
Traditional bike sharing had a revenue share of 87.9% in 2024 due to its reliability and structured nature. The fact that there are designated docking stations means that bikes are easily available and parked in an organized way, which is very attractive in cities where saving space is paramount. This structured system also offers users a sense of security because docking stations tend to be monitored or in well-lit, accessible locations.
The e-bike sharing is projected to increase at a CAGR of 11.3% during the period 2025-2030. The demand for environmentally friendly and energy-efficient modes of transport, especially in urban environments grappling with problems such as pollution and congestion. E-bikes provide a green option to conventional motorized transport, appealing to green commuters seeking to minimize their carbon footprint while taking advantage of the convenience of motorized support. Moreover, the trend for health and well-being has fueled interest in active modes of transport that also offer convenience. E-bikes are suited for a broad population of users who might not have the confidence or ability to use regular bicycles over long distances or up steep grades, making e-bikes a convenient and inclusive option.
Payment Method Insights
Subscription-based bicycle sharing had a revenue market share of 68.6% of the overall bicycle sharing market in 2024 based on its convenience and value for money for regular users. Subscription plans, often having economic monthly or annual subscription rates, provide unlimited or frequent use of bicycles and hence are highly popular among daily riders and regular cyclists. This anticipatory pricing strategy not only reduces the cost burden on users but also ensures steady income for service providers. In addition, subscription services foster loyalty and motivate users to utilize the service in the long run. Subscribed riders are likely to continue using the service because the commitment suits their regular transportation requirements. This has made operators enhance the user experience by offering rewards such as priority access, discounts, and seamless app integrations, further cementing the popularity of subscription models.
Bicycling on pay-as-you-go mode will continue to evolve at a CAGR of 10.5% over 2025-2030 because of its simplicity and popularity among occasional users. This model is particularly favored by those who do not desire to spend on long-term plans or subscriptions. It allows people to access bikes on an as-needed basis, thus being an extremely convenient option for travelers, infrequent riders, and trying-out cycling commuters. In addition, the increase in app-based platforms allowing straightforward booking and payment procedures. Such apps facilitate clients to discover and hire bicycles quickly, which makes the service quicker and more convenient. The inclusion of GPS tracking along with real-time information on availability enhances the experience further.
Service Insights
Docked-based bicycle sharing held a revenue share of 68.9% in the entire bicycle sharing market in 2024, led by its structured and dependable nature. Having dedicated docking stations makes bicycles readily available and parked in an orderly manner, responding to the demands of urban locations where space control is essential. The structured nature of the system gives users ease and security, as docking stations tend to be strategically placed in secure, well-accessible locations.
The dockless service bicycle sharing will register a CAGR of 10.6% during the period 2025-2030. The unmatched convenience it provides to customers. As opposed to docked systems, dockless services permit users to drop off and pick up bikes at any spot in the service area. This accessibility has contributed to their immense popularity in cities where time efficiency and convenience hold high value. Besides, the increasing focus on sustainability and carbon emission reduction has fueled the demand for shared mobility solutions such as dockless bicycles. Governments and private companies have aggressively promoted such services as part of larger strategies to curtail urban pollution and promote environmentally friendly means of transportation.
Regional Insights
The Asia Pacific bicycle sharing market represented a revenue share of 85.8% in 2024. There has been huge demand for sustainable and economical solutions for transportation following the rapid population growth and urbanization in economies like China and India. Bike-sharing services represent an environmentally friendly and affordable transportation solution to powered vehicles, as they solve issues related to congestion in traffic and pollution in populated cities. Besides, the extensive influence of supportive government policies and infrastructure investment, including the establishment of exclusive cycling lanes and public subsidies for bike-sharing schemes, has hastened the uptake of these services.
As an example, ADB and Japan opened a bike-sharing program in 2012 in Davao, Vientiane, and an Indonesian city to help optimize urban transportation, cut pollution emissions, and manage "last-mile" needs. This USD 2 million facility, backed by the Japan Fund for Poverty Reduction, looks to improve the quality of the air, minimize risks to pedestrians, and deliver green mobility to all of Asia.
North America Bicycle Sharing Market Trends
The North American bicycle sharing market contributed 5.3% revenue share in 2024. Growing concern over sustainable and environmentally friendly transport solutions has driven bicycle-sharing services demand as a car alternative, especially in cities. U.S. and Canadian cities are competing hard to lower carbon emissions and reduce traffic congestion, with bicycle-sharing playing a prominent role in their mobility and environmental strategies. Support from the government through subsidies, grants, and investment in cycling facilities, including parking lots and bike lanes, has also contributed to the growth of the market. The growth in health awareness among the population has also made cycling a popular form of active transportation that is both convenient and provides fitness.
For example, in July 2024, Montreal's bike-sharing service, Bixi, opened its first Carrefour Bixi at La Fontaine Park, where a docking station and repair shop are being placed together. The move is to de-centralize maintenance and cut down on downtime for damaged bikes. The effort is appreciated by users but with greater infrastructure installed, the parking and availability issues remain problems.
U.S. Bicycle Sharing Market Trends
The bicycle sharing industry in the U.S. is expected to grow at a significant CAGR over the forecast period, driven by the increasing awareness of sustainable transportation solutions. As urban areas face challenges such as traffic congestion and carbon emissions, bicycle sharing is becoming an attractive, eco-friendly alternative. Technological advancements in bike-sharing platforms, including mobile app integration and GPS tracking, are enhancing accessibility and convenience for users. Additionally, the rise in health consciousness and the adoption of e-bikes are expanding the appeal of bike-sharing programs to a wider audience, supporting its steady bicycle sharing industry growth.
Europe Bicycle Sharing Market Trends
The bicycle sharing market in Europe is expected to grow at a CAGR of 11.8% from 2025 to 2035 owing to increasing urbanization and a strong focus on sustainable transportation solutions. Governments are heavily investing in cycling infrastructure and green mobility initiatives, promoting bicycle sharing as a way to reduce traffic congestion and carbon emissions. Additionally, technological innovations, such as app-based rentals and integration with public transportation systems, are enhancing user convenience and accessibility. The rising adoption of e-bikes is also contributing to market expansion, appealing to a broader demographic seeking eco-friendly, cost-effective commuting options.
In October 2024, Augsburg, in partnership with Fifteen, launched a modern bike-sharing service featuring 700 standard bikes and 300 e-bikes arriving in 2025. Managed by Stadtwerke Augsburg (SWA), this initiative integrates advanced technology and user-friendly systems. Augsburg aims to enhance urban mobility, increase cycling, and reduce CO2 emissions by 55% by 2030.
Key Bicycle Sharing Company Insights
The bicycle sharing market is fragmented primarily due to the presence of several globally recognized players as well as regional players. Some prominent companies in the bicycle sharing industry are Hellobike, Lyft, Bolt, Lime, and others.
-
Bolt has expanded into micro-mobility, offering e-bikes and scooters. The company emphasizes affordability and sustainability, integrating its services into urban transportation systems. Bolt's partnerships, such as with Forest in London, aim to enhance accessibility and compete with other providers.
-
Lime is a pioneer in the bike-sharing space; Lime operates globally with a focus on dockless systems and electric bikes. Backed by Uber, Lime has invested significantly in expanding its fleet and improving user experience. It remains a key player in cities worldwide.
Key Bicycle Sharing Companies
The following are the leading companies in the bicycle sharing market. These companies collectively hold the largest market share and dictate industry trends.
- Hellobike
- Lyft
- Bolt
- Nextbike
- Ecobici
- Beryl
- Bikeshare Metro
- DonkeyBike
- Call a Bike
Recent Developments
-
In April 2025, Minneapolis launched a year-round shared e-bike and scooter program for residents and tourists, operated by Lime and Spin. Each company provides 1,000 e-bikes and scooters, including Class 1 pedal-assist and Class 2 e-bikes. Equity-focused distribution ensures that 30% of scooters serve north and south neighborhoods, 40% downtown, and 30% in other areas. The program surpassed pre-pandemic ridership in 2024, reaching 1.25 million rides. Seasonal operations are now extended through winter, weather permitting, enhancing accessibility to sustainable micro-mobility options.
-
In February 2025, Wicklow County Council collaborated with MOBY and re-launched and expanded its public e-bike sharing scheme on 1 March 2025. Starting with 100 e-bikes in Bray, the scheme extends to Greystones, Arklow, and Wicklow Town, with potential growth based on demand. Operated via the MOBY MOVE app, users can easily rent and park e-bikes at designated locations. Available 24/7, it offers pay-per-use and subscription pricing.
Bicycle Sharing Market Report Scope
Report Attribute |
Details |
Market revenue in 2025 |
USD 10.12 billion |
Revenue forecast in 2030 |
USD 16.44 billion |
Growth rate (Revenue) |
CAGR of 10.2% from 2025 to 2035 |
Actual data |
2018 - 2035 |
Forecast period |
2025 - 2035 |
Quantitative units |
Revenue in USD million/billion and CAGR from 2025 to 2035 |
Report coverage |
Revenue forecast, company ranking, competitive landscape, growth factors, and trends |
Segments covered |
Type, payment method, service, and region |
Regional scope |
North America; Europe; Asia Pacific; Latin America; and Middle East & Africa |
Country scope |
U.S; Canada; Mexico; Germany; UK; France; Italy; Spain; China; Japan; India; Australia & New Zealand; South Korea; Brazil; South Africa; UAE |
Key companies profiled |
Hellobike; Lyft; Bolt; Lime; Nextbike; Ecobici; Beryl; Bikeshare Metro; DonkeyBike; Call a Bike |
Customization |
Free report customization (equivalent up to 8 analysts working days) with purchase. Addition or alteration to country, regional & segment scope. |
Pricing and purchase options |
Avail customized purchase options to meet your exact research needs. Explore purchase options |
Global Bicycle Sharing Market Report Segmentation
This report forecasts revenue growth at the global, regional, and country levels and provides an analysis of the latest industry trends and opportunities in each of the sub-segments from 2018 to 2030. For this study, Grand View Research has segmented the global bicycle sharing market based on type, payment method, service, and region
-
Type Outlook (Revenue, USD Million, 2018 - 2035)
-
E-bike
-
Classic Bike
-
-
Payment Method Outlook (Revenue, USD Million, 2018 - 2035)
-
Pay-as-you-go
-
Subscription Based
-
-
Service Outlook (Revenue, USD Million, 2018 - 2035)
-
Docked
-
Dockless
-
-
Regional Outlook (Revenue, USD Million, 2018 - 2035)
-
North America
-
U.S.
-
Canada
-
Mexico
-
-
Europe
-
UK
-
Germany
-
France
-
Italy
-
Spain
-
-
Asia Pacific
-
Japan
-
China
-
India
-
South Korea
-
Australia & New Zealand
-
-
Latin America
-
Brazil
-
-
Middle East and Africa (MEA)
-
South Africa
-
UAE
-
-
Related Reports
- Smart Labelling in Logistics Market Size - By Component (Hardware, Software, Services), By Product (RFID Labels, NFC Lab...
- Premium Spirits Glass Bottle Market Size - By Capacity (Miniature, Low, Medium, and High), By Shape (Round, Square, Hexa...
- Tube Filling Machine Market Size - By Type (Semi-Automatic, Automatic) By Capacity (Less than 250 TPM, 251-500 TPM, 501-...
- Silicone Base Paper Market Size - By Type, By Coating (Single-Sided Silicone Coating, Double-Sided Silicone Coating, Non...
- Active & Intelligent Packaging Market Size - By Technology Type (Active Packaging, Intelligent Packaging), By End-user I...
- Corrugated Box Making Machine Market Size - By Type (Semi-automatic, Fully Automatic), By Box Type (Single layer, Multi ...
Table of Content
Chapter 1. Methodology and Scope
1.1. Market Segmentation & Scope
1.2. Market Definition
1.3. Information Procurement
1.3.1. Purchased Database
1.3.2. GVR’s Internal Database
1.3.3. Secondary Sources & Third-Party Perspectives
1.3.4. Primary Research
1.4. Information Analysis
1.4.1. Data Analysis Models
1.5. Market Formulation & Data Visualization
1.6. Data Validation & Publishing
Chapter 2. Executive Summary
2.1. Market Snapshot
2.2. Segment Snapshot
2.3. Competitive Landscape Snapshot
Chapter 3. Bicycle Sharing Market Variables, Trends & Scope
3.1. Market Lineage Outlook
3.1.1. Parent Market Outlook
3.1.2. Related Market Outlook
3.2. Industry Value Chain Analysis
3.2.1. Booking Mode Analysis and Trends
3.3. Market Dynamics
3.3.1. Market Driver Analysis
3.3.2. Market Restraint Analysis
3.3.3. Market Opportunities
3.3.4. Market Challenges
3.4. Industry Analysis Tools
3.4.1. Porter’s Five Forces Analysis
3.5. Market Entry Strategies
Chapter 4. Consumer Behavior Analysis
4.1. Demographic Analysis
4.2. Consumer Trends and Preferences
4.3. Factors Affecting Buying Decision
4.4. Consumer Service Adoption
4.5. Observations & Recommendations
Chapter 5. Bicycle Sharing Market: Type Estimates & Trend Analysis
5.1. Bicycle Sharing Market, By Type: Key Takeaways
5.2. Type Movement Analysis & Market Share, 2024 & 2030
5.3. Market Estimates & Forecasts, By Type, 2018 - 2030 (USD Million)
5.3.1. E-Bike
5.3.1.1. Market estimates and forecast, 2018 - 2030 (USD Million)
5.3.2. Classic Bike
5.3.2.1. Market estimates and forecast, 2018 - 2030 (USD Million)
Chapter 6. Bicycle Sharing Market: Payment Method Estimates & Trend Analysis
6.1. Bicycle Sharing Market, By Payment Method: Key Takeaways
6.2. Payment Method Movement Analysis & Market Share, 2024 & 2030
6.3. Market Estimates & Forecasts, By Payment Method, 2018 - 2030 (USD Million)
6.3.1. Pay-As-You-Go
6.3.1.1. Market estimates and forecast, 2018 - 2030 (USD Million)
6.3.2. Subscription Based
6.3.2.1. Market estimates and forecast, 2018 - 2030 (USD Million)
Chapter 7. Bicycle Sharing Market: Service Estimates & Trend Analysis
7.1. Bicycle Sharing Market, By Service: Key Takeaways
7.2. Service Movement Analysis & Market Share, 2024 & 2030
7.3. Market Estimates & Forecasts, By Service, 2018 - 2030 (USD Million)
7.3.1. Docked
7.3.1.1. Market estimates and forecast, 2018 - 2030 (USD Million)
7.3.2. Dockless
7.3.2.1. Market estimates and forecast, 2018 - 2030 (USD Million)
Chapter 8. Bicycle Sharing Market: Regional Estimates & Trend Analysis
8.1. Bicycle Sharing Market: Regional Outlook
8.2. Regional Marketplaces: Key Takeaways
8.3. Market Estimates & Forecasts, by Region, 2018 - 2030 (USD Million)
8.3.1. North America
8.3.1.1. Market estimates and forecast, 2018 - 2030 (USD Million)
8.3.1.2. U.S.
8.3.1.2.1. Key country dynamics
8.3.1.2.2. Market estimates and forecast, 2018 - 2030 (USD Million)
8.3.1.3. Canada
8.3.1.3.1. Key country dynamics
8.3.1.3.2. Market estimates and forecast, 2018 - 2030 (USD Million)
8.3.1.4. Mexico
8.3.1.4.1. Key country dynamics
8.3.1.4.2. Market estimates and forecast, 2018 - 2030 (USD Million)
8.3.2. Europe
8.3.2.1. Market estimates and forecast, 2018 - 2030 (USD Million)
8.3.2.2. UK
8.3.2.2.1. Key country dynamics
8.3.2.2.2. Market estimates and forecast, 2018 - 2030 (USD Million)
8.3.2.3. Germany
8.3.2.3.1. Key country dynamics
8.3.2.3.2. Market estimates and forecast, 2018 - 2030 (USD Million)
8.3.2.4. France
8.3.2.4.1. Key country dynamics
8.3.2.4.2. Market estimates and forecast, 2018 - 2030 (USD Million)
8.3.2.5. Italy
8.3.2.5.1. Key country dynamics
8.3.2.5.2. Market estimates and forecast, 2018 - 2030 (USD Million)
8.3.2.6. Spain
8.3.2.6.1. Key country dynamics
8.3.2.6.2. Market estimates and forecast, 2018 - 2030 (USD Million)
8.3.3. Asia Pacific
8.3.3.1. Market estimates and forecast, 2018 - 2030 (USD Million)
8.3.3.2. China
8.3.3.2.1. Key country dynamics
8.3.3.2.2. Market estimates and forecast, 2018 - 2030 (USD Million)
8.3.3.3. India
8.3.3.3.1. Key country dynamics
8.3.3.3.2. Market estimates and forecast, 2018 - 2030 (USD Million)
8.3.3.4. Japan
8.3.3.4.1. Key country dynamics
8.3.3.4.2. Market estimates and forecast, 2018 - 2030 (USD Million)
8.3.3.5. South Korea
8.3.3.5.1. Key country dynamics
8.3.3.5.2. Market estimates and forecast, 2018 - 2030 (USD Million)
8.3.3.6. Australia & New Zealand
8.3.3.6.1. Key country dynamics
8.3.3.6.2. Market estimates and forecast, 2018 - 2030 (USD Million)
8.3.4. Latin America
8.3.4.1. Brazil
8.3.4.1.1. Key country dynamics
8.3.4.1.2. Market estimates and forecast, 2018 - 2030 (USD Million)
8.3.5. Middle East & Africa
8.3.5.1. Market estimates and forecast, 2018 - 2030 (USD Million)
8.3.5.2. South Africa
8.3.5.2.1. Key country dynamics
8.3.5.2.2. Market estimates and forecast, 2018 - 2030 (USD Million)
8.3.5.3. UAE
8.3.5.3.1. Key country dynamics
8.3.5.3.2. Market estimates and forecast, 2018 - 2030 (USD Million)
Chapter 9. Bicycle Rental Market: Competitive Analysis
9.1. Recent Developments & Impact Analysis, by Key Market Participants
9.2. Company Categorization
9.3. Participant’s Overview
9.4. Financial Performance
9.5. Product Benchmarking
9.6. Company Market Share Analysis, 2024 (%)
9.7. Company Heat Map Analysis
9.8. Strategy Mapping
9.9. Company Profiles
9.9.1. Hellobike
9.9.1.1. Company Overview
9.9.1.2. Financial Performance
9.9.1.3. Service Portfolios
9.9.1.4. Strategic Initiatives
9.9.2. Lyft
9.9.2.1. Company Overview
9.9.2.2. Financial Performance
9.9.2.3. Service Portfolios
9.9.2.4. Strategic Initiatives
9.9.3. Bolt
9.9.3.1. Company Overview
9.9.3.2. Financial Performance
9.9.3.3. Service Portfolios
9.9.3.4. Strategic Initiatives
9.9.4. Lime
9.9.4.1. Company Overview
9.9.4.2. Financial Performance
9.9.4.3. Service Portfolios
9.9.4.4. Strategic Initiatives
9.9.5. Nextbike
9.9.5.1. Company Overview
9.9.5.2. Financial Performance
9.9.5.3. Service Portfolios
9.9.5.4. Strategic Initiatives
9.9.6. Ecobici
9.9.6.1. Company Overview
9.9.6.2. Financial Performance
9.9.6.3. Service Portfolios
9.9.6.4. Strategic Initiatives
9.9.7. Beryl
9.9.7.1. Company Overview
9.9.7.2. Financial Performance
9.9.7.3. Service Portfolios
9.9.7.4. Strategic Initiatives
9.9.8. Bikeshare Metro
9.9.8.1. Company Overview
9.9.8.2. Financial Performance
9.9.8.3. Service Portfolios
9.9.8.4. Strategic Initiatives
9.9.9. DonkeyBike
9.9.9.1. Company Overview
9.9.9.2. Financial Performance
9.9.9.3. Service Portfolios
9.9.9.4. Strategic Initiatives
9.9.10. Call a Bike
9.9.10.1. Company Overview
9.9.10.2. Financial Performance
9.9.10.3. Service Portfolios
9.9.10.4. Strategic Initiatives
List of Tables
Table 1 Bicycle sharing market: Key market driver analysis
Table 2 Bicycle sharing market: Key market restraint analysis
Table 3 Bicycle sharing market estimates & forecast, 2018 - 2030, by type, 2018 - 2030 (USD Million)
Table 4 E-bike sharing market estimates & forecast, 2018 - 2030 (USD Million)
Table 5 Classic bike sharing market estimates & forecast, 2018 - 2030 (USD Million)
Table 6 Bicycle sharing market estimates & forecast, 2018 - 2030, by payment method, 2018 - 2030 (USD Million)
Table 7 Bicycle sharing through pay-as-you-go market estimates & forecast, 2018 - 2030 (USD Million)
Table 8 Bicycle sharing through subscription based market estimates & forecast, 2018 - 2030 (USD Million)
Table 9 Bicycle sharing market estimates & forecast, 2018 - 2030, by service (USD Million)
Table 10 Docked bicycle sharing market estimates & forecast, 2018 - 2030 (USD Million)
Table 11 Dockless bicycle sharing market estimates & forecast, 2018 - 2030 (USD Million)
Table 12 Bicycle sharing market estimates & forecast, 2018 - 2030, by region, 2018 - 2030 (USD Million)
Table 13 North America bicycle sharing market estimates and forecast, 2018 - 2030 (USD Million)
Table 14 North America bicycle sharing market revenue estimates and forecast, by type, 2018 - 2030 (USD Million)
Table 15 North America bicycle sharing market revenue estimates and forecast, by payment method, 2018 - 2030 (USD Million)
Table 16 North America bicycle sharing market revenue estimates and forecast, by service, 2018 - 2030 (USD Million)
Table 17 US macro-economic outlay
Table 18 US bicycle sharing market estimates and forecast, 2018 - 2030 (USD Million)
Table 19 US bicycle sharing market revenue estimates and forecast, by type, 2018 - 2030 (USD Million)
Table 20 US bicycle sharing market revenue estimates and forecast, by payment method, 2018 - 2030 (USD Million)
Table 21 US bicycle sharing market revenue estimates and forecast, by service, 2018 - 2030 (USD Million)
Table 22 Canada macro-economic outlay
Table 23 Canada bicycle sharing market estimates and forecast, 2018 - 2030 (USD Million)
Table 24 Canada bicycle sharing market revenue estimates and forecast, by type, 2018 - 2030 (USD Million)
Table 25 Canada bicycle sharing market revenue estimates and forecast, by payment method, 2018 - 2030 (USD Million)
Table 26 Canada bicycle sharing market revenue estimates and forecast, by service, 2018 - 2030 (USD Million)
Table 27 Mexico macro-economic outlay
Table 28 Mexico bicycle sharing market estimates and forecast, 2018 - 2030 (USD Million)
Table 29 Mexico bicycle sharing market revenue estimates and forecast, by type, 2018 - 2030 (USD Million)
Table 30 Mexico bicycle sharing market revenue estimates and forecast, by payment method, 2018 - 2030 (USD Million)
Table 31 Mexico bicycle sharing market revenue estimates and forecast, by service, 2018 - 2030 (USD Million)
Table 32 Europe bicycle sharing market estimates and forecast, 2018 - 2030 (USD Million)
Table 33 Europe bicycle sharing market revenue estimates and forecast, by type, 2018 - 2030 (USD Million)
Table 34 Europe bicycle sharing market revenue estimates and forecast, by payment method, 2018 - 2030 (USD Million)
Table 35 Europe bicycle sharing market revenue estimates and forecast, by service, 2018 - 2030 (USD Million)
Table 36 UK macro-economic outlay
Table 37 UK bicycle sharing market estimates and forecast, 2018 - 2030 (USD Million)
Table 38 UK bicycle sharing market revenue estimates and forecast, by type, 2018 - 2030 (USD Million)
Table 39 UK bicycle sharing market revenue estimates and forecast, by payment method, 2018 - 2030 (USD Million)
Table 40 UK bicycle sharing market revenue estimates and forecast, by service, 2018 - 2030 (USD Million)
Table 41 Germany macro-economic outlay
Table 42 Germany bicycle sharing market estimates and forecast, 2018 - 2030 (USD Million)
Table 43 Germany bicycle sharing market revenue estimates and forecast, by type, 2018 - 2030 (USD Million)
Table 44 Germany bicycle sharing market revenue estimates and forecast, by payment method, 2018 - 2030 (USD Million)
Table 45 Germany bicycle sharing market revenue estimates and forecast, by service, 2018 - 2030 (USD Million)
Table 46 France macro-economic outlay
Table 47 France bicycle sharing market estimates and forecast, 2018 - 2030 (USD Million)
Table 48 France bicycle sharing market revenue estimates and forecast, by type, 2018 - 2030 (USD Million)
Table 49 France bicycle sharing market revenue estimates and forecast, by payment method, 2018 - 2030 (USD Million)
Table 50 France bicycle sharing market revenue estimates and forecast, by service, 2018 - 2030 (USD Million)
Table 51 Italy macro-economic outlay
Table 52 Italy bicycle sharing market estimates and forecast, 2018 - 2030 (USD Million)
Table 53 Italy bicycle sharing market revenue estimates and forecast, by type, 2018 - 2030 (USD Million)
Table 54 Italy bicycle sharing market revenue estimates and forecast, by payment method, 2018 - 2030 (USD Million)
Table 55 Italy bicycle sharing market revenue estimates and forecast, by service, 2018 - 2030 (USD Million)
Table 56 Spain macro-economic outlay
Table 57 Spain bicycle sharing market estimates and forecast, 2018 - 2030 (USD Million)
Table 58 Spain bicycle sharing market revenue estimates and forecast, by type, 2018 - 2030 (USD Million)
Table 59 Spain bicycle sharing market revenue estimates and forecast, by payment method, 2018 - 2030 (USD Million)
Table 60 Spain bicycle sharing market revenue estimates and forecast, by service, 2018 - 2030 (USD Million)
Table 61 Asia Pacific bicycle sharing market estimates and forecast, 2018 - 2030 (USD Million)
Table 62 Asia Pacific bicycle sharing market revenue estimates and forecast, by type, 2018 - 2030 (USD Million)
Table 63 Asia Pacific bicycle sharing market revenue estimates and forecast, by payment method, 2018 - 2030 (USD Million)
Table 64 Asia Pacific bicycle sharing market revenue estimates and forecast, by service, 2018 - 2030 (USD Million)
Table 65 China macro-economic outlay
Table 66 China bicycle sharing market estimates and forecast, 2018 - 2030 (USD Million)
Table 67 China bicycle sharing market revenue estimates and forecast, by type, 2018 - 2030 (USD Million)
Table 68 China bicycle sharing market revenue estimates and forecast, by payment method, 2018 - 2030 (USD Million)
Table 69 China bicycle sharing market revenue estimates and forecast, by service, 2018 - 2030 (USD Million)
Table 70 India macro-economic outlay
Table 71 India bicycle sharing market estimates and forecast, 2018 - 2030 (USD Million)
Table 72 India bicycle sharing market revenue estimates and forecast, by type, 2018 - 2030 (USD Million)
Table 73 India bicycle sharing market revenue estimates and forecast, by payment method, 2018 - 2030 (USD Million)
Table 74 India bicycle sharing market revenue estimates and forecast, by service, 2018 - 2030 (USD Million)
Table 75 Japan macro-economic outlay
Table 76 Japan bicycle sharing market estimates and forecast, 2018 - 2030 (USD Million)
Table 77 Japan bicycle sharing market revenue estimates and forecast, by type, 2018 - 2030 (USD Million)
Table 78 Japan bicycle sharing market revenue estimates and forecast, by payment method, 2018 - 2030 (USD Million)
Table 79 Japan bicycle sharing market revenue estimates and forecast, by service, 2018 - 2030 (USD Million)
Table 80 South Korea macro-economic outlay
Table 81 South Korea bicycle sharing market estimates and forecast, 2018 - 2030 (USD Million)
Table 82 South Korea bicycle sharing market revenue estimates and forecast, by type, 2018 - 2030 (USD Million)
Table 83 South Korea bicycle sharing market revenue estimates and forecast, by payment method, 2018 - 2030 (USD Million)
Table 84 South Korea bicycle sharing market revenue estimates and forecast, by service, 2018 - 2030 (USD Million)
Table 85 Australia & New Zealand macro-economic outlay
Table 86 Australia & New Zealand bicycle sharing market estimates and forecast, 2018 - 2030 (USD Million)
Table 87 Australia & New Zealand bicycle sharing market revenue estimates and forecast, by type, 2018 - 2030 (USD Million)
Table 88 Australia & New Zealand bicycle sharing market revenue estimates and forecast, by payment method, 2018 - 2030 (USD Million)
Table 89 Australia & New Zealand bicycle sharing market revenue estimates and forecast, by service, 2018 - 2030 (USD Million)
Table 90 Latin America bicycle sharing market estimates and forecast, 2018 - 2030 (USD Million)
Table 91 Latin America bicycle sharing market revenue estimates and forecast, by type, 2018 - 2030 (USD Million)
Table 92 Latin America bicycle sharing market revenue estimates and forecast, by payment method, 2018 - 2030 (USD Million)
Table 93 Latin America bicycle sharing market revenue estimates and forecast, by service, 2018 - 2030 (USD Million)
Table 94 Brazil macro-economic outlay
Table 95 Brazil bicycle sharing market estimates and forecast, 2018 - 2030 (USD Million)
Table 96 Brazil bicycle sharing market revenue estimates and forecast, by type, 2018 - 2030 (USD Million)
Table 97 Brazil bicycle sharing market revenue estimates and forecast, by payment method, 2018 - 2030 (USD Million)
Table 98 Brazil bicycle sharing market revenue estimates and forecast, by service, 2018 - 2030 (USD Million)
Table 99 Middle East & Africa bicycle sharing market estimates and forecast, 2018 - 2030 (USD Million)
Table 100 Middle East & Africa bicycle sharing market revenue estimates and forecast, by type, 2018 - 2030 (USD Million)
Table 101 Middle East & Africa bicycle sharing market revenue estimates and forecast, by payment method, 2018 - 2030 (USD Million)
Table 102 Middle East & Africa bicycle sharing market revenue estimates and forecast, by service, 2018 - 2030 (USD Million)
Table 103 South Africa macro-economic outlay
Table 104 South Africa bicycle sharing market estimates and forecast, 2018 - 2030 (USD Million)
Table 105 South Africa bicycle sharing market revenue estimates and forecast, by type, 2018 - 2030 (USD Million)
Table 106 South Africa bicycle sharing market revenue estimates and forecast, by payment method, 2018 - 2030 (USD Million)
Table 107 South Africa bicycle sharing market revenue estimates and forecast, by service, 2018 - 2030 (USD Million)
Table 108 UAE macro-economic outlay
Table 109 UAE bicycle sharing market estimates and forecast, 2018 - 2030 (USD Million)
Table 110 UAE bicycle sharing market revenue estimates and forecast, by type, 2018 - 2030 (USD Million)
Table 111 UAE bicycle sharing market revenue estimates and forecast, by payment method, 2018 - 2030 (USD Million)
Table 112 UAE bicycle sharing market revenue estimates and forecast, by service, 2018 - 2030 (USD Million)
Table 113 Recent developments & impact analysis, by key market participants
Table 114 Company market share, 2024 (%)
Table 115 Company heat map analysis, 2024
Table 116 Companies implementing key strategies
List of Figures
Fig. 1 Bicycle sharing market segmentation
Fig. 2 Information procurement
Fig. 3 Primary research pattern
Fig. 4 Primary research approaches
Fig. 5 Primary research process
Fig. 6 Market snapshot
Fig. 7 Segment snapshot
Fig. 8 Regional snapshot
Fig. 9 Competitive landscape snapshot
Fig. 10 Parent industry and bicycle sharing services market size, 2024 (USD Million)
Fig. 11 Bicycle sharing services market: Value chain analysis
Fig. 12 Bicycle sharing services market: Dynamics
Fig. 13 Bicycle sharing services market: Porter’s five forces analysis
Fig. 14 Bicycle sharing services market, by type: Key takeaways
Fig. 15 Bicycle sharing services market: Type movement analysis, 2024 & 2030 (%)
Fig. 16 E-bike sharing market estimates & forecast, 2018 - 2030 (USD Million)
Fig. 17 Classic bike sharing market estimates & forecast, 2018 - 2030 (USD Million)
Fig. 18 Bicycle sharing services market, by payment method: Key takeaways
Fig. 19 Bicycle sharing services market: Payment Method movement analysis, 2024 & 2030 (%)
Fig. 20 Bicycle sharing through pay-as-you-go market estimates & forecast, 2018 - 2030 (USD Million)
Fig. 21 Bicycle sharing through subscription based market estimates & forecast, 2018 - 2030 (USD Million)
Fig. 22 Bicycle sharing services market, by service: Key takeaways
Fig. 23 Bicycle sharing services market: Service movement analysis, 2024 & 2030 (%)
Fig. 24 Docked bicycle sharing market estimates & forecast, 2018 - 2030 (USD Million)
Fig. 25 Dockless bicycle sharing market estimates & forecast, 2018 - 2030 (USD Million)
Fig. 26 Bicycle sharing market: Regional outlook, 2024 & 2030 (USD Million)
Fig. 27 Regional marketplace: Key takeaways
Fig. 28 North America bicycle sharing market estimates & forecast, 2018 - 2030 (USD Million)
Fig. 29 US bicycle sharing market estimates & forecast, 2018 - 2030 (USD Million)
Fig. 30 Canada bicycle sharing market estimates & forecast, 2018 - 2030 (USD Million)
Fig. 31 Mexico bicycle sharing market estimates & forecast, 2018 - 2030 (USD Million)
Fig. 32 Europe bicycle sharing market estimates & forecast, 2018 - 2030 (USD Million)
Fig. 33 Germany bicycle sharing market estimates & forecast, 2018 - 2030 (USD Million)
Fig. 34 UK bicycle sharing market estimates & forecast, 2018 - 2030 (USD Million)
Fig. 35 France bicycle sharing market estimates & forecast, 2018 - 2030 (USD Million)
Fig. 36 Italy bicycle sharing market estimates & forecast, 2018 - 2030 (USD Million)
Fig. 37 Spain bicycle sharing market estimates & forecast, 2018 - 2030 (USD Million)
Fig. 38 Asia Pacific bicycle sharing market estimates & forecast, 2018 - 2030 (USD Million)
Fig. 39 China bicycle sharing market estimates & forecast, 2018 - 2030 (USD Million)
Fig. 40 India bicycle sharing market estimates & forecast, 2018 - 2030 (USD Million)
Fig. 41 Japan bicycle sharing market estimates & forecast, 2018 - 2030 (USD Million)
Fig. 42 South Korea bicycle sharing market estimates & forecast, 2018 - 2030 (USD Million)
Fig. 43 Australia & New Zealand bicycle sharing market estimates & forecast, 2018 - 2030 (USD Million)
Fig. 44 Latin America bicycle sharing market estimates & forecast, 2018 - 2030 (USD Million)
Fig. 45 Brazil bicycle sharing market estimates & forecast, 2018 - 2030 (USD Million)
Fig. 46 Middle East & Africa bicycle sharing market estimates & forecast, 2018 - 2030 (USD Million)
Fig. 47 South Africa bicycle sharing market estimates & forecast, 2018 - 2030 (USD Million)
Fig. 48 UAE bicycle sharing market estimates & forecast, 2018 - 2030 (USD Million)
Fig. 49 Key company categorization
Fig. 50 Company market share analysis, 2024
Fig. 51 Strategic framework of bicycle sharing
FAQ'S
For a single, multi and corporate client license, the report will be available in PDF format. Sample report would be given you in excel format. For more questions please contact:
Within 24 to 48 hrs.
You can contact Sales team (sales@marketinsightsresearch.com) and they will direct you on email
You can order a report by selecting payment methods, which is bank wire or online payment through any Debit/Credit card, Razor pay or PayPal.
Discounts are available.
Hard Copy