Baling Wire Market Size, Share & Trends Analysis Report

Baling Wire Market Size, Share & Trends Analysis Report By End-use (Recycling, Waste Management, Agriculture, Construction), By Region (North America, Asia Pacific, Europe), And Segment Forecasts, 2025 - 2030

Published Date: June - 2025 | Publisher: MIR | No of Pages: 230 | Industry: Advanced Materials | Format: Report available in PDF / Excel Format

View Details Buy Now 1500 Download Free Sample Ask for Discount Request Customization

Baling Wire Market Summary

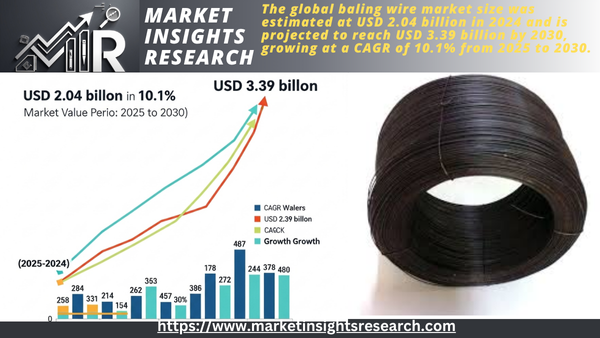
The global baling wire market size was estimated at USD 2.04 billion in 2024 and is projected to reach USD 3.39 billion by 2030, growing at a CAGR of 10.1% from 2025 to 2030.  Governments and environmental agencies are implementing strict regulations to promote recycling and reduce landfill waste.

Baling Wire Market

Download Free Sample   Ask for Discount  Request Customization 

Key Market Trends & Insights

  • Asia Pacific held over 46.0% revenue share of the global baling wire market.
  • The U.S. market for baling wire is experiencing significant growth, primarily driven by the expanding recycling and waste management sectors.
  • By end use, the recycling segment held the revenue share of over 42.0% in 2024.

Market Size & Forecast

  • 2024 Market SizeUSD 2.04 Billion
  • 2030 Projected Market SizeUSD 3.39 Billion
  • CAGR (2025-2030)10.1%
  • Asia PacificLargest market in 2024


As a result, industries such as paper, plastic, and metal recycling increasingly use baling wires to secure bales of recycled materials. This surge in recycling activities, especially in regions like Europe and North America, significantly boosts the demand for high-quality baling wire.

The need for efficient baling solutions has surged due to the increasing use of paper-based packaging, driven by the e-commerce boom. Baling wires are essential for securely bundling large quantities of paper and pulp products, making them indispensable in packaging and logistics. The growth of the pulp and paper industry, particularly in developing countries, continues to fuel the market.

The adoption of advanced farming practices is also a significant growth driver in agriculture. Automated baling machines are becoming common in modern farming, particularly for handling hay, straw, and other agricultural products. These machines require robust and durable baling wires to bind large bales effectively. The use of galvanized and annealed steel wires ensures durability and resistance to corrosion, making them a popular choice among farmers, especially in regions with high agricultural output.

Technological advancements in baling wire production are another critical factor boosting market growth. Manufacturers are investing in research and development to introduce stronger, more flexible, and corrosion-resistant baling wires. These innovations cater to industries requiring high-performance baling solutions, such as recycling plants and agricultural operations. As new, improved products enter the market, their adoption increases, further supporting market expansion.

Lastly, regional expansions and strategic collaborations among key players shape the global baling wire industry. Companies are partnering with industries such as waste management and agriculture to provide customized solutions. Emerging economies in Asia-Pacific and Latin America are particularly lucrative due to their expanding recycling initiatives and agricultural modernization. In April 2024, Sigma Polymers and D R Baling collaborated to develop a groundbreaking baling wire made entirely from 100% recycled plastic, which represents an important step forward in sustainable innovation. These partnerships enhance product distribution and boost market presence, contributing to the overall market growth.

Drivers, Opportunities & Restraints

The global baling wire industry is driven primarily by the rising focus on recycling and waste management. As governments and industries worldwide adopt stricter environmental regulations, the demand for efficient baling solutions is increasing. Baling wire is crucial in securing and compacting recycled materials, making it an essential tool in waste management and recycling processes. Additionally, the growth of industries such as paper, plastic, and metal recycling has fueled the demand for baling wire, as these industries need reliable solutions to manage bulk materials effectively.

Opportunities in the market are emerging from the expanding e-commerce sector, which generates a high volume of packaging waste. As the need for sustainable and efficient packaging management rises, the demand for baling wire is expected to grow. Technological advancements in manufacturing, including innovations that enhance durability and resistance to corrosion, are also creating new opportunities. Moreover, developing eco-friendly products aligns with the increasing emphasis on sustainable production, appealing to environmentally conscious industries.

Despite these positive trends, the market faces certain challenges. Fluctuations in raw material costs, particularly the price of steel, can impact manufacturers' profitability. Additionally, the rise of alternative solutions, such as biodegradable packaging and non-metallic binding materials, threatens the traditional market. Environmental regulations also impose challenges, as companies must constantly adapt to evolving standards to maintain compliance. Balancing innovation and sustainability while managing production costs remains a key challenge for industry players.

Market Analysis

Download Free Sample   Ask for Discount  Request Customization 

Report Coverage & Deliverables

The PDF report & online dashboard will help you understand

  • Competitive benchmarking
  • Historical data & forecasts
  • Company revenue shares
  • Regional opportunities
  • Latest trends & dynamics

End Use Insights

Recycling segment held the revenue share of over 42.0% in 2024. Governments across regions are enforcing stricter environmental regulations, encouraging industries and municipalities to recycle more and send less waste to landfills. Baling wire is essential in this process, as it binds and secures recyclable materials like paper, cardboard, plastic, and metal for easier handling, transport, and processing. As recycling becomes more widespread, the demand for baling wire rises significantly.

Agriculture is anticipated to register the fastest CAGR over the forecast period. Modern agricultural operations utilize baling machines to compress and bundle crops like hay, straw, and other forage materials efficiently. Baling wire is crucial in securing these bales, ensuring they remain intact during handling, storage, and transportation. The shift toward mechanization enhances productivity and necessitates reliable baling solutions, thereby boosting demand for the market in the agricultural sector.

Regional Insights

Asia Pacific held over 46.0% revenue share of the global baling wire market. The Asia Pacific region is experiencing significant growth, primarily driven by the region's rapid industrialization and urbanization. Countries like China and India are expanding their recycling and waste management sectors to address the increasing volume of waste generated by urban populations. This expansion necessitates efficient baling solutions, boosting the baling wire demand. Additionally, the growth of the pulp and paper industry in the region contributes to the rising need for baling wire, as it is essential for bundling and transporting paper products. 

North America Baling Wire Market Trends

The North American baling wire market is experiencing robust growth, driven by several key factors. One of the primary drivers is the increasing emphasis on recycling and waste management across the region. With growing environmental concerns and stringent regulations, industries are adopting efficient waste handling solutions, leading to a higher demand for baling wire to secure and transport recyclable materials. Additionally, the expansion of the pulp and paper industry, particularly in the U.S. and Canada, contributes to the rising need for baling wire, as it is essential for bundling and transporting paper products.

The baling wire market in the U.S. is experiencing significant growth, primarily driven by the expanding recycling and waste management sectors. With increasing environmental awareness and stringent regulations, industries are adopting efficient waste handling solutions, leading to a higher demand for baling wire to secure and transport recyclable materials. Additionally, the agricultural sector's shift toward mechanization has amplified the need for durable baling wires to bind hay and straw bales effectively. For instance, Impact Environmental Group (IEG) completed the acquisition of Olympic Wire and Equipment in December 2024. This strategic move expanded IEG's presence on the West Coast, enhancing its service capabilities in the baling equipment and wire sector. Such collaborations underscore the industry's commitment to meeting the growing demand for efficient baling solutions across various applications.

Europe Baling Wire Market Trends

The European baling wire market is experiencing significant growth, primarily driven by the region's strong emphasis on recycling and waste management. The European Union's stringent regulations and sustainability targets have increased demand for efficient baling solutions in industries such as paper, plastic, and metal recycling. For instance, the EU's Circular Economy Action Plan enforces a 76% paper recycling target by 2030, compelling mills to upgrade baling systems for material recovery efficiency. This regulatory pressure and technological advancements in baling machinery are boosting the demand for high-quality baling wire across the region.

Latin America Baling Wire Market Trends

The Latin American baling wire market is experiencing notable growth, driven by the region's expanding recycling and agricultural sectors. Countries such as Brazil, Mexico, and Argentina are investing in advanced recycling technologies to manage increasing waste volumes, leading to a higher demand for efficient baling solutions. In agriculture, the shift toward mechanization and the need for efficient storage and transportation of crops like hay and sugarcane are boosting the use of baling wire.

Middle East & Africa Baling Wire Market Trends

The baling wire market in the MEA is witnessing growth, primarily driven by the region's expanding recycling and agricultural sectors. Countries like Saudi Arabia, the United Arab Emirates, and South Africa are investing in advanced recycling technologies to manage increasing waste volumes, leading to a higher demand for efficient baling solutions. In agriculture, the shift toward mechanization and the need for efficient storage and transportation of crops like hay and sugarcane are boosting the use of baling wire.

Asia Pacific Region

Download Free Sample   Ask for Discount  Request Customization 

Key Baling Wire Company Insights

Some of the key players operating in the market include Accent Wire Tie, Advanced Wires Limited, and others

  • Accent Wire Tie offers a comprehensive range of baling wire options, including box wire, stand wire, and bale ties, catering to various industries such as recycling, agriculture, and waste management. With a robust manufacturing and distribution network, Accent Wire Tie ensures timely delivery of high-quality products across the U.S., supporting efficient operations for its clients.
  • Advanced Wires Limited specializes in the production of high-quality baling wire products tailored for the recycling and waste management industries. Leveraging over 46 years of combined experience in the recycling sector, the company offers a diverse range of baling wire solutions, including Quicklink bale ties, cut and looped wire, auto-galvanized wire, and re-wound coils. Their products are designed to meet the specific needs of various applications, ensuring durability and efficiency in securing recyclable materials.

Key Baling Wire Companies

The following are the leading companies in the baling wire market. These companies collectively hold the largest market share and dictate industry trends.

Recent Developments

  • In April 2024, Stadler introduced a new automated bale wire remover, the Wirex, designed to address the challenges faced by recycling facilities in efficiently and safely removing wire from bales. Baling wire is essential for handling large volumes of waste, but removing it is often labor-intensive. The Wirex uses advanced sensor detection and measurement systems to automatically measure bales and remove wires from single- and cross-wired bales in a single pass, eliminating the risk of double feeding.

Baling Wire Market Report Scope

Report Attribute

Details

Market size value in 2025

USD 2.10 billion

Revenue forecast in 2030

USD 3.39 billion

Growth rate

CAGR of 10.1% from 2025 to 2030

Base year for estimation

2024

Historical data

2018-2023

Forecast period

2025-2030

Quantitative Units

Volume in kilotons, revenue in USD million/billion, and CAGR from 2025 to 2030

Report coverage

Volume forecast, revenue forecast, competitive landscape, growth factors, and trends

Segments covered

End use, region

Regional scope

North America; Europe; Asia Pacific; Latin America; Middle East & Africa

Country scope

U.S.; Canada; Mexico; UK; Germany; France; Italy; Russia; Spain; Portugal; China; India; Japan; South Korea; Brazil; Saudi Arabia; UAE

Key companies profiled

Accent Wire Tie; Advanced Wires Limited; AGST Draht-und Biegetechnik GmbH; Barnfather Wire; Heinrich Erdmann GmbH; Gama Metal; Hörle Wire AB; MAZZOLENI TRAFILERIE BERGAMASCHE SPA; IBERMETAIS; Metalurgia S.A.

Customization scope

Free report customization (equivalent to up to 8 analysts' working days) with purchase. Changes or additions to the scope of the country, region, and segment are possible.

Pricing and purchase options

Avail yourself of customized purchase options to meet your exact research needs.  Explore purchase options

Global Baling Wire Market Report Segmentation

This report forecasts revenue and volume growth at the global, regional, and country levels and provides an analysis of the latest industry trends in each of the sub-segments from 2018 to 2030. For the purpose of this study, Grand View Research has segmented the global baling wire market report based on end use and region

  • End Use Outlook (Volume, Kilotons; Revenue, USD Million; 2018-2030)

    • Recycling

    • Waste Management

    • Agriculture

    • Construction

    • Others

  • Regional Outlook (Volume, Kilotons; Revenue, USD Million; 2018-2030)

    • North America

      • U.S.

      • Canada

      • Mexico

    • Europe

      • UK

      • Germany

      • France

      • Italy

      • Russia

      • Spain

      • Portugal

    • Asia Pacific

      • China

      • India

      • Japan

      • South Korea

    • Latin America

      • Brazil

    • Middle East & Africa

      • Saudi Arabia

      • UAE

Table of Content

Chapter 1. Methodology and Scope
                    1.1. Market Segmentation & Scope
                    1.2. Market Definition
                    1.3. Information Procurement
                        1.3.1. Information Analysis
                        1.3.2. Data Analysis Models
                        1.3.3. Market Formulation & Data Visualization
                        1.3.4. Data Validation & Publishing
                    1.4. Research Scope and Assumptions
                        1.4.1. List of Data Sources
Chapter 2. Executive Summary
                    2.1. Market Outlook
                    2.2. Segmental Outlook
                    2.3. Competitive Outlook
Chapter 3. Market Variables, Trends, and Scope
                    3.1. Global Baling Wire Market Outlook
                    3.2. Industry Value Chain Analysis
                        3.2.1. Sales Channel Analysis
                    3.3. Technology Overview
                    3.4. Regulatory Framework
                    3.5. Market Dynamics
                        3.5.1. Market Driver Analysis
                        3.5.2. Market Restraint Analysis
                    3.6. Industry Trends
                        3.6.1. Economic Trends
                        3.6.2. ESG Trends
                    3.7. Porter’s Five Forces Analysis
                        3.7.1. Bargaining Power of Suppliers
                        3.7.2. Bargaining Power of Buyers
                        3.7.3. Threat of Substitution
                        3.7.4. Threat of New Entrants
                        3.7.5. Competitive Rivalry
                    3.8. PESTLE Analysis
                        3.8.1. Political
                        3.8.2. Economic
                        3.8.3. Social Landscape
                        3.8.4. Technology
                        3.8.5. Environmental
                        3.8.6. Legal
Chapter 4. Baling Wire Market: End Use Estimates & Trend Analysis
                    4.1. Baling Wire Market: End Use Movement Analysis, 2024 & 2030
                    4.2. Recycling
                        4.2.1. Market estimates and forecasts, 2018 - 2030 (USD Million) (Kilotons)
                    4.3. Waste Management
                        4.3.1. Market estimates and forecasts, 2018 - 2030 (USD Million) (Kilotons)
                        4.4. Agriculture
                        4.4.1. Market estimates and forecasts, 2018 - 2030 (USD Million) (Kilotons)
                    4.5. Construction
                        4.5.1. Market estimates and forecasts, 2018 - 2030 (USD Million) (Kilotons)
                    4.6. Others
                        4.6.1. Market estimates and forecasts, 2018 - 2030 (USD Million) (Kilotons)
Chapter 5. Baling Wire Market: Regional Estimates & Trend Analysis
                    5.1. Regional Analysis, 2024 & 2030
                    5.2. North America
                        5.2.1. Market estimates and forecasts, 2018 - 2030 (USD Million) (Kilotons)
                        5.2.2. Market estimates and forecasts, by end use, 2018 - 2030 (USD Million) (Kilotons)
                        5.2.3. U.S.
                            5.2.3.1. Market estimates and forecasts, 2018 - 2030 (USD Million) (Kilotons)
                           5.2.3.2. Market estimates and forecasts, by end use, 2018 - 2030 (USD Million) (Kilotons)
                        5.2.4. Canada
                           5.2.4.1. Market estimates and forecasts, 2018 - 2030 (USD Million) (Kilotons)
                           5.2.4.2. Market estimates and forecasts, by end use, 2018 - 2030 (USD Million) (Kilotons)
                        5.2.5. Mexico
                           5.2.5.1. Market estimates and forecasts, 2018 - 2030 (USD Million) (Kilotons)
                           5.2.5.2. Market estimates and forecasts, by end use, 2018 - 2030 (USD Million) (Kilotons)
                    5.3. Europe
                        5.3.1. Market estimates and forecasts, 2018 - 2030 (USD Million) (Kilotons)
                        5.3.2. Market estimates and forecasts, by end use, 2018 - 2030 (USD Million) (Kilotons)
                        5.3.3. UK
                           5.3.3.1. Market estimates and forecasts, 2018 - 2030 (USD Million) (Kilotons)
                           5.3.3.2. Market estimates and forecasts, by end use, 2018 - 2030 (USD Million) (Kilotons)
                        5.3.4. Germany
                           5.3.4.1. Market estimates and forecasts, 2018 - 2030 (USD Million) (Kilotons)
                           5.3.4.2. Market estimates and forecasts, by end use, 2018 - 2030 (USD Million) (Kilotons)
                        5.3.5. France
                           5.3.5.1. Market estimates and forecasts, 2018 - 2030 (USD Million) (Kilotons)
                           5.3.5.2. Market estimates and forecasts, by end use, 2018 - 2030 (USD Million) (Kilotons)
                        5.3.6. Italy
                           5.3.6.1. Market estimates and forecasts, 2018 - 2030 (USD Million) (Kilotons)
                           5.3.6.2. Market estimates and forecasts, by end use, 2018 - 2030 (USD Million) (Kilotons)
                        5.3.7. Russia
                           5.3.7.1. Market estimates and forecasts, 2018 - 2030 (USD Million) (Kilotons)
                           5.3.7.2. Market estimates and forecasts, by end use, 2018 - 2030 (USD Million) (Kilotons)
                        5.3.8. Spain
                           5.3.8.1. Market estimates and forecasts, 2018 - 2030 (USD Million) (Kilotons)
                           5.3.8.2. Market estimates and forecasts, by end use, 2018 - 2030 (USD Million) (Kilotons)
                        5.3.9. Portugal
                           5.3.9.1. Market estimates and forecasts, 2018 - 2030 (USD Million) (Kilotons)
                           5.3.9.2. Market estimates and forecasts, by end use, 2018 - 2030 (USD Million) (Kilotons)
                    5.4. Asia Pacific
                        5.4.1. Market estimates and forecasts, 2018 - 2030 (USD Million) (Kilotons)
                        5.4.2. Market estimates and forecasts, by end use, 2018 - 2030 (USD Million) (Kilotons)
                        5.4.3. China
                           5.4.3.1. Market estimates and forecasts, 2018 - 2030 (USD Million) (Kilotons)
                           5.4.3.2. Market estimates and forecasts, by end use, 2018 - 2030 (USD Million) (Kilotons)
                        5.4.4. India
                           5.4.4.1. Market estimates and forecasts, 2018 - 2030 (USD Million) (Kilotons)
                           5.4.4.2. Market estimates and forecasts, by end use, 2018 - 2030 (USD Million) (Kilotons)
                        5.4.5. Japan
                           5.4.5.1. Market estimates and forecasts, 2018 - 2030 (USD Million) (Kilotons)
                           5.4.5.2. Market estimates and forecasts, by end use, 2018 - 2030 (USD Million) (Kilotons)
                        5.4.6. South Korea
                           5.4.6.1. Market estimates and forecasts, 2018 - 2030 (USD Million) (Kilotons)
                           5.4.6.2. Market estimates and forecasts, by end use, 2018 - 2030 (USD Million) (Kilotons)
                    5.5. Latin America
                        5.5.1. Market estimates and forecasts, 2018 - 2030 (USD Million) (Kilotons)
                        5.5.2. Market estimates and forecasts, by end use, 2018 - 2030 (USD Million) (Kilotons)
                        5.5.3. Brazil
                           5.5.3.1. Market estimates and forecasts, 2018 - 2030 (USD Million) (Kilotons)
                           5.5.3.2. Market estimates and forecasts, by end use, 2018 - 2030 (USD Million) (Kilotons)
                    5.6. Middle East & Africa
                        5.6.1. Market estimates and forecasts, 2018 - 2030 (USD Million) (Kilotons)
                        5.6.2. Market estimates and forecasts, by end use, 2018 - 2030 (USD Million) (Kilotons)
                        5.6.3. Saudi Arabia
                           5.6.3.1. Market estimates and forecasts, 2018 - 2030 (USD Million) (Kilotons)
                           5.6.3.2. Market estimates and forecasts, by end use, 2018 - 2030 (USD Million) (Kilotons)
                        5.6.4. UAE
                           5.6.4.1. Market estimates and forecasts, 2018 - 2030 (USD Million) (Kilotons)
                           5.6.4.2. Market estimates and forecasts, by end use, 2018 - 2030 (USD Million) (Kilotons)
Chapter 6. Competitive Landscape
                    6.1. Recent Developments & Impact Analysis, By Key Market Participants
                    6.2. Company Categorization
                    6.3. Heat Map Analysis
                    6.4. Vendor Landscape
                        6.4.1. List of equipment suppliers
                        6.4.2. List of distributors
                    6.5. List of prospective end-users
                    6.6. Strategy Initiatives
                    6.7. Company Profiles/Listing
                        6.7.1. Accent Wire Tie
                           6.7.1.1. Company Overview
                           6.7.1.2. Financial Performance
                           6.7.1.3. Product Benchmarking
                        6.7.2. Advanced Wires Limited
                           6.7.2.1. Company Overview
                           6.7.2.2. Financial Performance
                           6.7.2.3. Product Benchmarking
                        6.7.3. AGST Draht-und Biegetechnik GmbH
                           6.7.3.1. Company Overview
                           6.7.3.2. Financial Performance
                           6.7.3.3. Product Benchmarking
                        6.7.4. Barnfather Wire
                           6.7.4.1. Company Overview
                           6.7.4.2. Financial Performance
                           6.7.4.3. Product Benchmarking
                        6.7.5. Heinrich Erdmann GmbH
                           6.7.5.1. Company Overview
                           6.7.5.2. Financial Performance
                           6.7.5.3. Product Benchmarking
                        6.7.6. Gama Metal
                           6.7.6.1. Company Overview
                           6.7.6.2. Financial Performance
                           6.7.6.3. Product Benchmarking
                        6.7.7. Hörle Wire AB
                           6.7.7.1. Company Overview
                           6.7.7.2. Financial Performance
                           6.7.7.3. Product Benchmarking
                        6.7.8. MAZZOLENI TRAFILERIE BERGAMASCHE SPA
                           6.7.8.1. Company Overview
                           6.7.8.2. Financial Performance
                           6.7.8.3. Product Benchmarking
                        6.7.9. IBERMETAIS
                           6.7.9.1. Company Overview
                           6.7.9.2. Financial Performance
                           6.7.9.3. Product Benchmarking
                        6.7.10. Metalurgia S.A.
                           6.7.10.1. Company Overview
                           6.7.10.2. Financial Performance
                           6.7.10.3. Product Benchmarking


List of Tables

Table 1 Baling wire market estimates & forecasts, 2018 - 2030 (USD Million) (Kilotons)
Table 2 North America baling wire market estimates & forecasts, 2018 - 2030 (USD Million) (Kilotons)
Table 3 North America baling wire market estimates & forecasts, by end use, 2018 - 2030 (USD Million) (Kilotons)
Table 4 U.S. baling wire market estimates & forecasts, 2018 - 2030 (USD Million) (Kilotons)
Table 5 U.S. baling wire market estimates & forecasts, by end use, 2018 - 2030 (USD Million) (Kilotons)
Table 6 Canada baling wire market estimates & forecasts, 2018 - 2030 (USD Million) (Kilotons)
Table 7 Canada baling wire market estimates & forecasts, by end use, 2018 - 2030 (USD Million) (Kilotons)
Table 8 Mexico baling wire market estimates & forecasts, 2018 - 2030 (USD Million) (Kilotons)
Table 9 Mexico baling wire market estimates & forecasts, by end use, 2018 - 2030 (USD Million) (Kilotons)
Table 10 Europe baling wire market estimates & forecasts, 2018 - 2030 (USD Million) (Kilotons)
Table 11 Europe baling wire market estimates & forecasts, by end use, 2018 - 2030 (USD Million) (Kilotons)
Table 12 UAE baling wire market estimates & forecasts, 2018 - 2030 (USD Million) (Kilotons)
Table 13 UAE baling wire market estimates & forecasts, by end use, 2018 - 2030 (USD Million) (Kilotons)
Table 14 Germany baling wire market estimates & forecasts, 2018 - 2030 (USD Million) (Kilotons)
Table 15 Germany baling wire market estimates & forecasts, by end use, 2018 - 2030 (USD Million) (Kilotons)
Table 16 France baling wire market estimates & forecasts, 2018 - 2030 (USD Million) (Kilotons)
Table 17 France baling wire market estimates & forecasts, by end use, 2018 - 2030 (USD Million) (Kilotons)
Table 18 Italy baling wire market estimates & forecasts, 2018 - 2030 (USD Million) (Kilotons)
Table 19 Italy baling wire market estimates & forecasts, by end use, 2018 - 2030 (USD Million) (Kilotons)
Table 20 Russia baling wire market estimates & forecasts, 2018 - 2030 (USD Million) (Kilotons)
Table 21 Russia baling wire market estimates & forecasts, by end use, 2018 - 2030 (USD Million) (Kilotons)
Table 22 Spain baling wire market estimates & forecasts, 2018 - 2030 (USD Million) (Kilotons)
Table 23 Spain baling wire market estimates & forecasts, by end use, 2018 - 2030 (USD Million) (Kilotons)
Table 24 Portugal baling wire market estimates & forecasts, 2018 - 2030 (USD Million) (Kilotons)
Table 25 Portugal baling wire market estimates & forecasts, by end use, 2018 - 2030 (USD Million) (Kilotons)
Table 26 Asia Pacific baling wire market estimates & forecasts, 2018 - 2030 (USD Million) (Kilotons)
Table 27 Asia Pacific baling wire market estimates & forecasts, by end use, 2018 - 2030 (USD Million) (Kilotons)
Table 28 China baling wire market estimates & forecasts, 2018 - 2030 (USD Million) (Kilotons)
Table 29 China baling wire market estimates & forecasts, by end use, 2018 - 2030 (USD Million) (Kilotons)
Table 30 India baling wire market estimates & forecasts, 2018 - 2030 (USD Million) (Kilotons)
Table 31 India baling wire market estimates & forecasts, by end use, 2018 - 2030 (USD Million) (Kilotons)
Table 32 Japan baling wire market estimates & forecasts, 2018 - 2030 (USD Million) (Kilotons)
Table 33 Japan baling wire market estimates & forecasts, by end use, 2018 - 2030 (USD Million) (Kilotons)
Table 34 South Korea baling wire market estimates & forecasts, 2018 - 2030 (USD Million) (Kilotons)
Table 35 South Korea baling wire market estimates & forecasts, by end use, 2018 - 2030 (USD Million) (Kilotons)
Table 36 Latin America baling wire market estimates & forecasts, 2018 - 2030 (USD Million) (Kilotons)
Table 37 Latin America baling wire market estimates & forecasts, by end use, 2018 - 2030 (USD Million) (Kilotons)
Table 38 Brazil baling wire market estimates & forecasts, 2018 - 2030 (USD Million) (Kilotons)
Table 39 Brazil baling wire market estimates & forecasts, by end use, 2018 - 2030 (USD Million) (Kilotons)
Table 40 Middle East & Africa baling wire market estimates & forecasts, 2018 - 2030 (USD Million) (Kilotons)
Table 41 Middle East & Africa baling wire market estimates & forecasts, by end use, 2018 - 2030 (USD Million) (Kilotons)
Table 42 Saudi Arabia baling wire market estimates & forecasts, 2018 - 2030 (USD Million) (Kilotons)
Table 43 Saudi Arabia baling wire market estimates & forecasts, by end use, 2018 - 2030 (USD Million) (Kilotons)
Table 44 UAE baling wire market estimates & forecasts, 2018 - 2030 (USD Million) (Kilotons)
Table 45 UAE baling wire market estimates & forecasts, by end use, 2018 - 2030 (USD Million) (Kilotons)


List of Figures

Fig. 1 Market segmentation
Fig. 2 Information procurement
Fig. 3 Data analysis models
Fig. 4 Market formulation and validation
Fig. 5 Market snapshot
Fig. 6 Segmental outlook - End Use
Fig. 7 Competitive outlook
Fig. 8 Baling wire market outlook, 2018–2030 (USD Million)
Fig. 9 Value chain analysis
Fig. 10 Market dynamics
Fig. 11 Porter’s analysis
Fig. 12 PESTEL analysis
Fig. 13 Baling wire market, by end use: Key takeaways
Fig. 14 Baling wire market, by end use: Market share, 2024 & 2030
Fig. 15 Baling wire market: regional analysis, 2024
Fig. 16 Baling wire market, by region: Key takeaways

Key Baling Wire Companies:

The following are the leading companies in the baling wire market. These companies collectively hold the largest market share and dictate industry trends.

FAQ'S

For a single, multi and corporate client license, the report will be available in PDF format. Sample report would be given you in excel format. For more questions please contact:

sales@marketinsightsresearch.com

Within 24 to 48 hrs.

You can contact Sales team (sales@marketinsightsresearch.com) and they will direct you on email

You can order a report by selecting payment methods, which is bank wire or online payment through any Debit/Credit card, Razor pay or PayPal.