Iron Casting Market Size, Trends & Forecast

Iron Casting Market Size, Share & Trends Analysis Report By Product (Gray, Ductile, Malleable), By Application (Automotive, Machinery & Tools, Railways), By Region (North America, Europe, APAC, Central & South America, Middle East & Africa), And Segment Forecasts

Published Date: May - 2025 | Publisher: MIR | No of Pages: 260 | Industry: advance materials | Format: Report available in PDF / Excel Format

View Details Buy Now 2999 Download Free Sample Ask for Discount Request Customization

Iron Casting Market Size & Trends

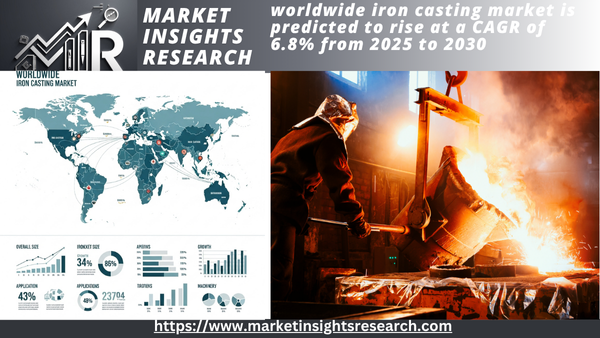
Projected to be USD 117.4 billion in 2024, the worldwide iron casting market is predicted to rise at a CAGR of 6.8% from 2025 to 2030. Rising investments in the rail sector globally and demand for iron cast pipes from water-related infrastructure projects and oil & gas are expected to propel market expansion.

iron casting market

Download Free Sample   Ask for Discount  Request Customization 

Key Highlights

  • Asia Pacific dominated the industry, with a revenue share of 66.9% in 2024.
  • The North American iron casting market is set to experience steady growth, driven by robust economic indicators and substantial investments in infrastructure.
  • In terms of the application segment, Graycast Iron held a revenue share of over 64.0% in 2024.
  • In terms of application segment, in 2024, the automotive industry held the largest revenue share of the global iron casting market.

We anticipate the railway application to register a CAGR of 8.1% in revenue during the forecast period. Rising investments in railway infrastructure are anticipated to positively impact the iron casting market growth over the forecast period. For instance, in April 2025, the 135-year-old rail bridge over the Mithi River in Bandra, Mumbai, one of the last remaining cast-iron screw-pile bridges on Indian Railways, began to be dismantled and replaced, marking the end of the cast-iron era in Indian railway infrastructure. Built in 1888, the bridge featured eight massive cast iron pillars weighing 8-10 tons and extending 15-20 meters deep into the riverbed to anchor the structure. This transition is significant in the context of iron casting, as the bridge’s original screw-pile design exemplified the 19th-century engineering marvels made possible by cast iron technology.

Cast iron, known for its compressive strength and moldability, was widely used in bridge construction during the industrial era. However, the material’s brittleness and susceptibility to corrosion over time have led to structural vulnerabilities, especially in critical infrastructure like railways. The replacement of the Mithi River Bridge with RCC reflects the broader shift in civil engineering from cast iron toward more durable and resilient materials, ensuring greater safety and longevity for modern rail networks.

Growing concerns among individuals about the potential health risks from non-stick cookware and increasing global demand for toxin-free kitchen cookware have led cast iron cookware manufacturers to increase their production capacity. Over the forecast period, we expect this to positively influence the growth of the gray cast iron segment of the market. For instance, in September 2024, Caraway announced the launch of its new Enameled Cast Iron Cookware Collection, a major expansion of its non-toxic, design-driven kitchenware offerings. This collection combines traditional cast iron durability and heat retention with a unique three-layer enamel coating that eliminates seasoning and ensures easy cleaning.

Market Size

Download Free Sample   Ask for Discount  Request Customization 

Report Coverage & Deliverables

The PDF report & online dashboard will help you understand

  • Competitive benchmarking
  • Historical data & forecasts
  • Company revenue shares
  • Regional opportunities
  • Latest trends & dynamics

Drivers, Opportunities & Restraints

The global iron casting industry rebounded in 2024, driven by resurgent demand from end-use sectors such as machinery & tools, railway, and energy infrastructure. A notable development during this time was the French government's commitment to invest EUR 170 million (~USD 188.2 million) annually until 2024 to enhance rail freight transportation as part of a broader sustainability initiative. This effort followed an earlier investment of EUR 3.5 billion (~USD 3.87 billion) over six years to regenerate trains and rail routes.

Additionally, the machine tools sector recorded a robust recovery. In Q4 2021, Italy posted double-digit growth in machine tool orders, with a 70.1% increase in the order index to 130.4 compared to 2020. This spike was driven by foreign demand, an active domestic market, and government support for industrial modernization.

The automotive sector, historically a key consumer of gray iron castings, has seen a gradual decline in gray iron usage due to the growing emphasis on vehicle lightweighting and fuel efficiency. Automakers increasingly adopt aluminum and other lightweight materials to meet stringent emission and performance standards, which has constrained gray iron demand in automotive applications.

Aluminum castings are preferred mainly in various industries, especially automotive, which affects the consumption of iron castings. Automakers are under regulatory pressure to improve vehicle efficiency and reduce the environmental impact of greenhouse gas emissions. Aluminum is considered a sustainable material owing to its contribution to reducing carbon dioxide (COâ‚‚). It prevents around 70 million tons of unwanted COâ‚‚ from mixing into the air. In vehicles, using 100 kilograms of aluminum can help save 46 liters of fuel per year.

Product Insights & Trends

Gray cast iron held a revenue share of over 64.0% in 2024. Its growing applications in various industries, including railways and pipes & fittings, propel the segment's growth in the iron casting industry. It has graphite particles that precipitate in a spherical form, resulting in ductile iron's high strength and toughness. Ductile cast iron is anticipated to register a CAGR of 7.0% in terms of revenue across the forecast period, ranging from 2025 to 2030.

Ductile cast iron is widely used for manufacturing tractors and implement parts, crankshafts, cylinder heads, switch boxes, electrical fittings, motor frames, flywheels, drive pulleys, work rolls, and circuit breakers. Its microstructure results in more ductile cast iron than gray or white cast iron, making it suitable for producing water and sewage pipes.

Numerous industries, including agriculture, tools and equipment, automotive, metal, and mining, widely use malleable cast iron. It manufactures electrical fittings and equipment, washers, brackets, hand tools, mining hardware, pipe fittings, farm equipment, bearing caps, steering gear housing, and machine parts.

Application Insights & Trends

In 2024, the automotive industry held the largest revenue share of the global iron casting market. Engine blocks are usually cast from aluminum alloy or cast iron. Although aluminum offers weight reduction, cast iron is preferred owing to factors such as durability, the ability to resist high internal pressure, more strength, more horsepower, and cost-efficiency. In 2024, the automotive industry held a revenue share of over 29% in the global iron casting market.

Tata Motors plans to introduce Avinya, an all-electric luxury brand, in January 2025, positioning it above its current Tata lineup and below Land Rover. The connection to iron casting lies in the manufacturing and structural requirements of premium electric vehicles like Avinya. While the EMA platform emphasizes lightweight materials and advanced battery integration, iron casting remains crucial for specific components that require high strength and durability, such as subframes, suspension mounts, and specific drivetrain elements.

Machinery and tools widely use iron castings due to their good wear resistance, high strength, and good machinability. While steel can serve as an alternative to cast iron, the manufacturing of machine tools prefers ductile iron due to its superior vibration-damping capacity.

Regional Insights

The North American iron casting market is set to experience steady growth, driven by robust economic indicators and substantial investments in infrastructure. According to the International Monetary Fund (IMF), the real GDP growth in North America was estimated at 2.3% in 2023, with a slight decline to 2.0% in 2024 and 2025. The U.S. economy is a key contributor to this growth, highlighting the region's commitment to enhancing its economic landscape through significant construction and infrastructure initiatives.

North America region

Download Free Sample   Ask for Discount  Request Customization 

U.S. Iron Casting Market Trends

In the U.S., infrastructure revitalization projects-spurred by the Bipartisan Infrastructure Law-boosted the need for ductile and gray iron castings used in piping, bridges, and heavy machinery. The U.S. dominated the North American iron casting market with a revenue share of over 84% in 2024. U.S.-based foundries like Waupaca Foundry and Neenah Enterprises ramped up production capacity to meet increased domestic demand and reduce dependency on imported components. Simultaneously, the rise of electric vehicle (EV) manufacturing in Michigan and other automotive hubs led to increased investment in precision castings, particularly for lightweight and heat-resistant iron components.

Asia Pacific Iron Casting Market Trends

Asia Pacific dominated the industry, with a revenue share of 66.9% in 2023. Asia Pacific is one of the world's largest consumers of iron castings. The increasing demand for iron castings in various industries, such as infrastructure and construction, automotive, renewables, machine tooling, and pipes, is anticipated to augment the demand over the forecast period. The countries in the region are investing in improving railway connectivity, which is anticipated to augment the demand for iron castings. For instance, in October 2021, the Vietnamese government announced it would invest USD 10.5 billion to build and upgrade rail infrastructure across the country by 2030.

Europe Iron Casting Market Trends

The iron casting industry in Europe is characterized by a strong industrial base, advanced manufacturing technologies, and a significant presence in end-user industries such as automotive, construction, and machinery. Countries like Germany, Italy, France, and the UK are leading contributors, with Germany holding a dominant position due to its well-established automotive and engineering sectors. European foundries benefit from stringent quality standards and environmental regulations that have led to the adoption of cleaner and more efficient casting techniques. The emphasis on lightweight and high-strength components, particularly in automotive and transportation, drives innovation in material formulations and process automation.

Key Iron Casting Company Insights

Some of the key players operating in the market include Proterial Ltd., LIAONING BORUI MACHINERY CO., LTD. (DANDONG FOUNDRY), and Brakes India.

  • Proterial Ltd., originally founded as Tobata Foundry in 1910, has evolved into a global leader in high-performance materials manufacturing. The company has a rich history marked by key mergers and acquisitions, including collaborations with Hitachi Metals and other specialized firms.

  • Dandong Foundry has nearly 70 years of experience in producing gray iron and ductile iron castings. The company’s annual output reaches 8,000 tons, and 50% of its products are exported to markets such as the U.S., Germany, Australia, the UK, Italy, and Japan, reflecting our strong global presence.

Key Iron Casting Companies

The following are the leading companies in the iron casting market. These companies collectively hold the largest market share and dictate industry trends.

Recent Developments

  • In June 2022, Brakes India took the lead by collaborating with the Volvo Group to produce 'green castings' for engine components. Brakes India manufactures these castings using 100% renewable energy and sustainable practices to significantly reduce carbon emissions. The initiative is expected to produce over 180,000 tons of iron castings annually, potentially reducing COâ‚‚ emissions by 210 million tons across the industry if widely adopted. This collaboration underscores the growing emphasis on eco-friendly manufacturing processes in the automotive sector.

  • Crescent Foundry has emerged as a leading cast iron product manufacturer, emphasizing quality and technological advancement. With a production capacity of 2,500 tons per month, the company caters to over 50 countries, supplying products for various sectors, including agriculture, telecom, and infrastructure. Their commitment to innovation is evident in their use of advanced technologies and adherence to international standards, positioning them as a key player in the global market.

Iron Casting Market Report Scope

Report Attribute

Details

Market size value in 2025

USD 124.2 billion

Revenue forecast in 2030

USD 172.4 billion

Growth rate

CAGR of 6.8% from 2025 to 2030

Base year for estimation

2024

Historical data

2018-2023

Forecast period

2025-2030

Quantitative units

Revenue in USD million/billion, volume in kilotons, and CAGR from 2025 to 2030

Report coverage

Revenue & volume forecast, company ranking, competitive landscape, growth factors, and trends

Segments covered

Product, application, region

Regional scope

North America, Europe, Asia Pacific, Central & South America, Middle East & Africa

Country scope

U.S.; Canada; Mexico; Germany; UK; France; Italy; Russia; Türkiye; China; India; Japan; South Korea; Indonesia; Brazil; Argentina; South Africa

Key companies profiled

Proterial Ltd.; LIAONING BORUI MACHINERY CO., LTD (DANDONG FOUNDRY); Brakes India; OSCO Industries Inc.; Chamberlin; Crescent Foundry; Georg Fischer Ltd.; GIS (Grupo Industrial Saltillo); Newby Holdings Limited; Castings P.L.C.; CALMET

Customization scope

We offer free report customization, equivalent to up to 8 analysts' working days, with every purchase. Changes or additions to the scope of the country, region, and segment are possible.

Pricing and purchase options

Avail yourself of customized purchase options to meet your exact research needs. Explore purchase options

Global Iron Casting Market Report Segmentation

This report forecasts volume & revenue growth at the global, country, and regional levels and provides an analysis of the latest trends in each of the subsegments from 2018 to 2030. For this study, MIR has segmented the report on the global iron casting market based on product, application, and region

  • Product Outlook (Volume, Kilotons; Revenue, USD Million, 2018-2030)

    • Gray Cast Iron

    • Ductile Cast Iron

    • Malleable Cast Iron

  • Application Outlook (Volume, Kilotons; Revenue, USD Million, 2018-2030)

    • Automotive

    • Machinery & tools

    • Pipes & fittings

    • Railways

    • Power generation

    • Others

  • Regional Outlook (Volume, Kilotons; Revenue, USD Million, 2018-2030)

    • North America

      • U.S.

      • Canada

      • Mexico

    • Europe

      • Germany

      • France

      • Italy

      • UK

      • Russia

      • Türkiye

    • Asia Pacific

      • China

      • India

      • Japan

      • South Korea

      • Indonesia

    • Central & South America

      • Brazil

      • Argentina

    • Middle East & Africa

      • South Africa

Table of Content

Chapter 1: Methodology and Scope
                    1.1. Market Segmentation & Scope
                    1.2. Market Definition
                    1.3. Information Procurement
                        1.3.1. Information Analysis
                        1.3.2. Market Formulation & Data Visualization
                        1.3.3. Data Validation & Publishing
                    1.4. Research Scope and Assumptions
                        1.4.1. List of Data Sources
Chapter 2. Executive Summary
                    2.1. Market Snapshot
                    2.2. Segmental Outlook
                    2.3. Competitive Outlook
Chapter 3. Market Variables, Trends, and Scope
                    3.1. Global Iron Casting Market Outlook
                    3.2. Value Chain Analysis
                    3.3. Technology Overview
                    3.4. Regulatory Framework
                    3.5. Market Dynamics
                        3.5.1. Market Driver Analysis
                        3.5.2. Market Restraint Analysis
                        3.5.3. Industry Trends
                            3.5.3.1. Economic
                            3.5.3.2. ESG Analysis
                    3.6. Porter’s Five Forces Analysis
                        3.6.1. Bargaining Power of Suppliers
                        3.6.2. Bargaining Power of Buyers
                        3.6.3. Threat of Substitution
                        3.6.4. Threat of New Entrants
                        3.6.5. Competitive Rivalry
                    3.7. PESTLE Analysis
                        3.7.1. Political
                        3.7.2. Economic
                        3.7.3. Social Landscape
                        3.7.4. Technology
                        3.7.5. Environmental
                        3.7.6. Legal
Chapter 4. Iron Casting Market: Product Estimates & Trend Analysis
                    4.1. Iron Casting Market: Product Movement Analysis, 2024 & 2030
                    4.2. Gray
                        4.2.1. Market estimates and forecasts, 2018–2030 (USD million) (Kilotons)
                    4.3. Duct
                        4.3.1. Market estimates and forecasts, 2018–2030 (USD million) (Kilotons)
                    4.4. Malle
                        4.4.1. Market estimates and forecasts, 2018–2030 (USD million) (Kilotons)
Chapter 5. Iron Casting Market: Application Estimates & Trend Analysis
                    5.1. Iron Casting Market: Application Movement Analysis, 2024 & 2030
                    5.2. Automotive
                        5.2.1. Market estimates and forecasts, 2018–2030 (USD million) (Kilotons)
                    5.3. Machinery & Tools
                        5.3.1. Market estimates and forecasts, 2018 - 2030 (USD Million) (Kilotons)
                    5.4. Pipes & Fittings
                        5.4.1. Market estimates and forecasts, 2018 - 2030 (USD Million) (Kilotons)
                    5.5. Railways
                        5.5.1. Market estimates and forecasts, 2018 - 2030 (USD Million) (Kilotons)
                    5.6. Power Generation
                        5.6.1. Market estimates and forecasts, 2018 - 2030 (USD Million) (Kilotons)
                    5.7. Others
                        5.7.1. Market estimates and forecasts, 2018 - 2030 (USD Million) (Kilotons)
Chapter 6. Iron Casting Market: Regional Estimates & Trend Analysis
                    6.1. Regional Analysis, 2024 & 2030
                    6.2. North America
                        6.2.1. Market estimates and forecasts, 2018 - 2030 (USD Million) (Kilotons)
                        6.2.2. Market estimates and forecasts, By product, 2018 - 2030 (USD Million) (Kilotons)
                        6.2.3. Market estimates and forecasts, by application, 2018 - 2030 (USD Million) (Kilotons)
                        6.2.4. U.S.
                            6.2.4.1. Market estimates and forecasts, 2018 - 2030 (USD Million) (Kilotons)
                            6.2.4.2. Market estimates and forecasts, By product, 2018 - 2030 (USD Million) (Kilotons)
                            6.2.4.3. Market estimates and forecasts, by application, 2018 - 2030 (USD Million) (Kilotons)
                        6.2.5. Canada
                            6.2.5.1. Market estimates and forecasts, 2018 - 2030 (USD Million) (Kilotons)
                            6.2.5.2. Market estimates and forecasts, By product, 2018 - 2030 (USD Million) (Kilotons)
                            6.2.5.3. Market estimates and forecasts, by application, 2018 - 2030 (USD Million) (Kilotons)
                        6.2.6. Mexico
                            6.2.6.1. Market estimates and forecasts, 2018 - 2030 (USD Million) (Kilotons)
                            6.2.6.2. Market estimates and forecasts, By product, 2018 - 2030 (USD Million) (Kilotons)
                            6.2.6.3. Market estimates and forecasts, by application, 2018 - 2030 (USD Million) (Kilotons)
                    6.3. Europe
                        6.3.1. Market estimates and forecasts, 2018 - 2030 (USD Million) (Kilotons)
                        6.3.2. Market estimates and forecasts, By product, 2018 - 2030 (USD Million) (Kilotons)
                        6.3.3. Market estimates and forecasts, by application, 2018 - 2030 (USD Million) (Kilotons)
                        6.3.4. Germany
                            6.3.4.1. Market estimates and forecasts, 2018 - 2030 (USD Million) (Kilotons)
                            6.3.4.2. Market estimates and forecasts, By product, 2018 - 2030 (USD Million) (Kilotons)
                            6.3.4.3. Market estimates and forecasts, by application, 2018 - 2030 (USD Million) (Kilotons)
                        6.3.5. UK
                            6.3.5.1. Market estimates and forecasts, 2018 - 2030 (USD Million) (Kilotons)
                            6.3.5.2. Market estimates and forecasts, By product, 2018 - 2030 (USD Million) (Kilotons)
                            6.3.5.3. Market estimates and forecasts, by application, 2018 - 2030 (USD Million) (Kilotons)
                        6.3.6. France
                            6.3.6.1. Market estimates and forecasts, 2018 - 2030 (USD Million) (Kilotons)
                            6.3.6.2. Market estimates and forecasts, By product, 2018 - 2030 (USD Million) (Kilotons)
                            6.3.6.3. Market estimates and forecasts, by application, 2018 - 2030 (USD Million) (Kilotons)
                        6.3.7. Italy
                            6.3.7.1. Market estimates and forecasts, 2018 - 2030 (USD Million) (Kilotons)
                            6.3.7.2. Market estimates and forecasts, By product, 2018 - 2030 (USD Million) (Kilotons)
                            6.3.7.3. Market estimates and forecasts, by application, 2018 - 2030 (USD Million) (Kilotons)
                        6.3.8. Russia
                            6.3.8.1. Market estimates and forecasts, 2018 - 2030 (USD Million) (Kilotons)
                            6.3.8.2. Market estimates and forecasts, By product, 2018 - 2030 (USD Million) (Kilotons)
                            6.3.8.3. Market estimates and forecasts, by application, 2018 - 2030 (USD Million) (Kilotons)
                        6.3.9. Türkiye
                            6.3.9.1. Market estimates and forecasts, 2018 - 2030 (USD Million) (Kilotons)
                            6.3.9.2. Market estimates and forecasts, By product, 2018 - 2030 (USD Million) (Kilotons)
                            6.3.9.3. Market estimates and forecasts, by application, 2018 - 2030 (USD Million) (Kilotons)
                    6.4. Asia Pacific
                        6.4.1. Market estimates and forecasts, 2018 - 2030 (USD Million) (Kilotons)
                        6.4.2. Market estimates and forecasts, By product, 2018 - 2030 (USD Million) (Kilotons)
                        6.4.3. Market estimates and forecasts, by application, 2018 - 2030 (USD Million) (Kilotons)
                        6.4.4. China
                            6.4.4.1. Market estimates and forecasts, 2018 - 2030 (USD Million) (Kilotons)
                            6.4.4.2. Market estimates and forecasts, By product, 2018 - 2030 (USD Million) (Kilotons)
                            6.4.4.3. Market estimates and forecasts, by application, 2018 - 2030 (USD Million) (Kilotons)
                        6.4.5. Japan
                            6.4.5.1. Market estimates and forecasts, 2018 - 2030 (USD Million) (Kilotons)
                            6.4.5.2. Market estimates and forecasts, By product, 2018 - 2030 (USD Million) (Kilotons)
                            6.4.5.3. Market estimates and forecasts, by application, 2018 - 2030 (USD Million) (Kilotons)
                        6.4.6. India
                            6.4.6.1. Market estimates and forecasts, 2018 - 2030 (USD Million) (Kilotons)
                            6.4.6.2. Market estimates and forecasts, By product, 2018 - 2030 (USD Million) (Kilotons)
                            6.4.6.3. Market estimates and forecasts, by application, 2018 - 2030 (USD Million) (Kilotons)
                        6.4.7. South Korea
                            6.4.7.1. Market estimates and forecasts, 2018 - 2030 (USD Million) (Kilotons)
                            6.4.7.2. Market estimates and forecasts, By product, 2018 - 2030 (USD Million) (Kilotons)
                            6.4.7.3. Market estimates and forecasts, by application, 2018 - 2030 (USD Million) (Kilotons)
                        6.4.8. Indonesia
                            6.4.8.1. Market estimates and forecasts, 2018 - 2030 (USD Million) (Kilotons)
                            6.4.8.2. Market estimates and forecasts, By product, 2018 - 2030 (USD Million) (Kilotons)
                            6.4.8.3. Market estimates and forecasts, by application, 2018 - 2030 (USD Million) (Kilotons)
                    6.5. Central & South America
                        6.5.1. Market estimates and forecasts, 2018 - 2030 (USD Million) (Kilotons)
                        6.5.2. Market estimates and forecasts, By Product, 2018 - 2030 (USD Million) (Kilotons)
                        6.5.3. Market estimates and forecasts, by application, 2018 - 2030 (USD Million) (Kilotons)
                        6.5.4. Brazil
                            6.5.4.1. Market estimates and forecasts, 2018 - 2030 (USD Million) (Kilotons)
                            6.5.4.2. Market estimates and forecasts, By product, 2018 - 2030 (USD Million) (Kilotons)
                            6.5.4.3. Market estimates and forecasts, by application, 2018 - 2030 (USD Million) (Kilotons)
                        6.5.5. Argentina
                            6.5.5.1. Market estimates and forecasts, 2018 - 2030 (USD Million) (Kilotons)
                            6.5.5.2. Market estimates and forecasts, By product, 2018 - 2030 (USD Million) (Kilotons)
                            6.5.5.3. Market estimates and forecasts, by application, 2018 - 2030 (USD Million) (Kilotons)
                    6.6. Middle East & Africa
                        6.6.1. Market estimates and forecasts, 2018 - 2030 (USD Million) (Kilotons)
                        6.6.2. Market estimates and forecasts, By product, 2018 - 2030 (USD Million) (Kilotons)
                        6.6.3. Market estimates and forecasts, by application, 2018 - 2030 (USD Million) (Kilotons)
                        6.6.4. South Africa
                            6.6.4.1. Market estimates and forecasts, 2018 - 2030 (USD Million) (Kilotons)
                            6.6.4.2. Market estimates and forecasts, By product, 2018 - 2030 (USD Million) (Kilotons)
                            6.6.4.3. Market estimates and forecasts, by application, 2018 - 2030 (USD Million) (Kilotons)
Chapter 7. Competitive Landscape
                    7.1. Recent Developments & Impact Analysis, By Key Market Participants
                    7.2. Kraljic Matrix
                    7.3. Company Categorization
                    . Heat Map Analysis
                    7.5. Vendor Landscape
                        7.5.1. List of Raw Material Suppliers
                        7.5.2. List of Distributors
                        7.5.3. List of Other Prominent Manufacturers
                    7.6. List of Prospective End Users
                    7.7. Strategy Mapping
                    7.8. Company Profiles/Listing
                        7.8.1. Proterial Ltd.
                            7.8.1.1. Company Overview
                            7.8.1.2. Financial Performance
                            7.8.1.3. Product Benchmarking
                        7.8.2. LIAONING BORUI MACHINERY CO., LTD (DANDONG FOUNDRY)
                            7.8.2.1. Company Overview
                            7.8.2.2. Financial Performance
                            7.8.2.3. Product Benchmarking
                        7.8.3. Brakes India
                            7.8.3.1. Company Overview
                            7.8.3.2. Financial Performance
                            7.8.3.3. Product Benchmarking
                        7.8.4. OSCO Industries Inc.
                            7.8.4.1. Company Overview
                            7.8.4.2. Financial Performance
                            7.8.4.3. Product Benchmarking
                        7.8.5. Chamberlin
                            7.8.5.1. Company Overview
                            7.8.5.2. Financial Performance
                            7.8.5.3. Product Benchmarking
                        7.8.6. Crescent Foundry
                            7.8.6.1. Company Overview
                            7.8.6.2. Financial Performance
                            7.8.6.3. Product Benchmarking
                        7.8.7. Georg Fischer Ltd.
                            7.8.7.1. Company Overview
                            7.8.7.2. Financial Performance
                            7.8.7.3. Product Benchmarking
                        7.8.8. Grupo Industrial Saltillo (GIS)
                            7.8.8.1. Company Overview
                            7.8.8.2. Financial Performance
                            7.8.8.3. Product Benchmarking
                        7.8.9. Newby Holdings Limited
                            7.8.9.1. Company Overview
                            7.8.9.2. Financial Performance
                            7.8.9.3. Product Benchmarking
                        7.8.10. Castings P.L.C.
                            7.8.10.1. Company Overview
                            7.8.10.2. Financial Performance
                            7.8.10.3. Product Benchmarking
                        7.8.11. CALMET
                            7.8.11.1. Company Overview
                            7.8.11.2. Financial Performance
                            7.8.11.3. Product Benchmarking


List of Tables

TABLE 1 Iron casting market estimate and forecasts, 2018 - 2030 (USD Million) (Kilotons)
TABLE 2 Gray iron casting market estimates & forecasts, 2018 - 2030 (USD Million) (Kilotons)
TABLE 3 Ductile iron casting market estimate and forecasts, 2018 - 2030 (USD Million) (Kilotons)
TABLE 4 Malleable iron casting market estimate and forecasts, 2018 - 2030 (USD Million) (Kilotons)
TABLE 5 Iron casting market estimates & forecasts, by automotive 2018 - 2030 (USD Million) (Kilotons)
TABLE 6 Iron casting market estimates & forecasts, by machinery & tool, 2018 - 2030 (USD Million) (Kilotons)
TABLE 7 Iron casting market estimates & forecasts, by pipes & fittings, 2018 - 2030 (USD Million) (Kilotons)
TABLE 8 Iron casting market estimates & forecasts, by railways, 2018 - 2030 (USD Million) (Kilotons)
TABLE 9 Iron casting market estimates & forecasts, by power generation. 2018 - 2030 (USD Million) (Kilotons)
TABLE 10 Iron casting market estimates & forecasts, by other applications. 2018 - 2030 (USD Million) (Kilotons)
TABLE 11 North America iron casting market estimates & forecasts, 2018 - 2030 (USD Million) (Kilotons)
TABLE 12 North America iron casting market estimates & forecasts, by product, 2018 - 2030 (USD Million)
TABLE 13 North America iron casting market estimates & forecasts, by product, 2018 - 2030 (Kilotons)
TABLE 14 North America iron casting market estimates & forecasts, by application, 2018 - 2030 (USD Million)
TABLE 15 North America iron casting market estimates & forecasts, by application, 2018 - 2030 (Kilotons)
TABLE 16 U.S. iron casting market estimates & forecasts, 2018 - 2030 (USD Million) (Kilotons)
TABLE 17 U.S. iron casting market estimates & forecasts, by product, 2018 - 2030 (USD Million)
TABLE 18 U.S. iron casting market estimates & forecasts, by product, 2018 - 2030 (Kilotons)
TABLE 19 U.S. iron casting market estimates & forecasts, by application, 2018 - 2030 (USD Million)
TABLE 20 U.S. iron casting market estimates & forecasts, by application, 2018 - 2030 (Kilotons)
TABLE 21 Canada iron casting market estimates & forecasts, 2018 - 2030 (USD Million) (Kilotons)
TABLE 22 Canada iron casting market estimates & forecasts, by product, 2018 - 2030 (USD Million)
TABLE 23 Canada iron casting market estimates & forecasts, by product, 2018 - 2030 (Kilotons)
TABLE 24 Canada iron casting market estimates & forecasts, by application, 2018 - 2030 (USD Million)
TABLE 25 Canada iron casting market estimates & forecasts, by application, 2018 - 2030 (Kilotons)
TABLE 26 Mexico iron casting market estimates & forecasts, 2018 - 2030 (USD Million) (Kilotons)
TABLE 27 Mexico iron casting market estimates & forecasts, by product, 2018 - 2030 (USD Million)
TABLE 28 Mexico iron casting market estimates & forecasts, by product, 2018 - 2030 (Kilotons)
TABLE 29 Mexico iron casting market estimates & forecasts, by application, 2018 - 2030 (USD Million)
TABLE 30 Mexico iron casting market estimates & forecasts, by application, 2018 - 2030 (Kilotons)
TABLE 31 Europe iron casting market estimates & forecasts, 2018 - 2030 (USD Million) (Kilotons)
TABLE 32 Europe iron casting market estimates & forecasts, by product, 2018 - 2030 (USD Million)
TABLE 33 Europe iron casting market estimates & forecasts, by product, 2018 - 2030 (Kilotons)
TABLE 34 Europe iron casting market estimates & forecasts, by application, 2018 - 2030 (USD Million)
TABLE 35 Europe iron casting market estimates & forecasts, by application, 2018 - 2030 (Kilotons)
TABLE 36 Germany iron casting market estimates & forecasts, 2018 - 2030 (USD Million) (Kilotons)
TABLE 37 Germany iron casting market estimates & forecasts, by product, 2018 - 2030 (USD Million)
TABLE 38 Germany iron casting market estimates & forecasts, by product, 2018 - 2030 (Kilotons)
TABLE 39 Germany iron casting market estimates & forecasts, by application, 2018 - 2030 (USD Million)
TABLE 40 Germany iron casting market estimates & forecasts, by application, 2018 - 2030 (Kilotons)
TABLE 41 UK iron casting market estimates & forecasts, 2018 - 2030 (USD Million) (Kilotons)
TABLE 42 UK iron casting market estimates & forecasts, by product, 2018 - 2030 (USD Million)
TABLE 43 UK iron casting market estimates & forecasts, by product, 2018 - 2030 (Kilotons)
TABLE 44 UK iron casting market estimates & forecasts, by application, 2018 - 2030 (USD Million)
TABLE 45 UK iron casting market estimates & forecasts, by application, 2018 - 2030 (Kilotons)
TABLE 46 France iron casting market estimates & forecasts, 2018 - 2030 (USD Million) (Kilotons)
TABLE 47 France iron casting market estimates & forecasts, by product, 2018 - 2030 (USD Million)
TABLE 48 France iron casting market estimates & forecasts, by product, 2018 - 2030 (Kilotons)
TABLE 49 France iron casting market estimates & forecasts, by application, 2018 - 2030 (USD Million)
TABLE 50 France iron casting market estimates & forecasts, by application, 2018 - 2030 (Kilotons)
TABLE 51 Italy iron casting market estimates & forecasts, 2018 - 2030 (USD Million) (Kilotons)
TABLE 52 Italy iron casting market estimates & forecasts, by product, 2018 - 2030 (USD Million)
TABLE 53 Italy iron casting market estimates & forecasts, by product, 2018 - 2030 (Kilotons)
TABLE 54 Italy iron casting market estimates & forecasts, by application, 2018 - 2030 (USD Million)
TABLE 55 Italy iron casting market estimates & forecasts, by application, 2018 - 2030 (Kilotons)
TABLE 56 Russia iron casting market estimates & forecasts, 2018 - 2030 (USD Million) (Kilotons)
TABLE 57 Russia iron casting market estimates & forecasts, by product, 2018 - 2030 (USD Million)
TABLE 58 Russia iron casting market estimates & forecasts, by product, 2018 - 2030 (Kilotons)
TABLE 59 Russia iron casting market estimates & forecasts, by application, 2018 - 2030 (USD Million)
TABLE 60 Russia iron casting market estimates & forecasts, by application, 2018 - 2030 (Kilotons)
TABLE 61 Türkiye iron casting market estimates & forecasts, 2018 - 2030 (USD Million) (Kilotons)
TABLE 62 Türkiye iron casting market estimates & forecasts, by product, 2018 - 2030 (USD Million)
TABLE 63 Türkiye iron casting market estimates & forecasts, by product, 2018 - 2030 (Kilotons)
TABLE 64 Türkiye iron casting market estimates & forecasts, by application, 2018 - 2030 (USD Million)
TABLE 65 Türkiye iron casting market estimates & forecasts, by application, 2018 - 2030 (Kilotons)
TABLE 66 Asia Pacific iron casting market estimates & forecasts, 2018 - 2030 (USD Million) (Kilotons)
TABLE 67 Asia Pacific iron casting market estimates & forecasts, by product, 2018 - 2030 (USD Million)
TABLE 68 Asia Pacific iron casting market estimates & forecasts, by product, 2018 - 2030 (Kilotons)
TABLE 69 Asia Pacific iron casting market estimates & forecasts, by application, 2018 - 2030 (USD Million)
TABLE 70 Asia Pacific iron casting market estimates & forecasts, by application, 2018 - 2030 (Kilotons)
TABLE 71 China iron casting market estimates & forecasts, 2018 - 2030 (USD Million) (Kilotons)
TABLE 72 China iron casting market estimates & forecasts, by product, 2018 - 2030 (USD Million)
TABLE 73 China iron casting market estimates & forecasts, by product, 2018 - 2030 (Kilotons)
TABLE 74 China iron casting market estimates & forecasts, by application, 2018 - 2030 (USD Million)
TABLE 75 China iron casting market estimates & forecasts, by application, 2018 - 2030 (Kilotons)
TABLE 76 Japan iron casting market estimates & forecasts, 2018 - 2030 (USD Million) (Kilotons)
TABLE 77 Japan iron casting market estimates & forecasts, by product, 2018 - 2030 (USD Million)
TABLE 78 Japan iron casting market estimates & forecasts, by product, 2018 - 2030 (Kilotons)
TABLE 79 Japan iron casting market estimates & forecasts, by application, 2018 - 2030 (USD Million)
TABLE 80 Japan iron casting market estimates & forecasts, by application, 2018 - 2030 (Kilotons)
TABLE 81 India iron casting market estimates & forecasts, 2018 - 2030 (USD Million) (Kilotons)
TABLE 82 India iron casting market estimates & forecasts, by product, 2018 - 2030 (USD Million)
TABLE 83 India iron casting market estimates & forecasts, by product, 2018 - 2030 (Kilotons)
TABLE 84 India iron casting market estimates & forecasts, by application, 2018 - 2030 (USD Million)
TABLE 85 India iron casting market estimates & forecasts, by application, 2018 - 2030 (Kilotons)
TABLE 86 South Korea iron casting market estimates & forecasts, 2018 - 2030 (USD Million) (Kilotons)
TABLE 87 South Korea iron casting market estimates & forecasts, by product, 2018 - 2030 (USD Million)
TABLE 88 South Korea iron casting market estimates & forecasts, by product, 2018 - 2030 (Kilotons)
TABLE 89 South Korea iron casting market estimates & forecasts, by application, 2018 - 2030 (USD Million)
TABLE 90 South Korea iron casting market estimates & forecasts, by application, 2018 - 2030 (Kilotons)
TABLE 91 Indonesia iron casting market estimates & forecasts, 2018 - 2030 (USD Million) (Kilotons)
TABLE 92 Indonesia iron casting market estimates & forecasts, by product, 2018 - 2030 (USD Million)
TABLE 93 Indonesia iron casting market estimates & forecasts, by product, 2018 - 2030 (Kilotons)
TABLE 94 Indonesia iron casting market estimates & forecasts, by application, 2018 - 2030 (USD Million)
TABLE 95 Indonesia iron casting market estimates & forecasts, by application, 2018 - 2030 (Kilotons)
TABLE 96 Central & South America iron casting market estimates & forecasts, 2018 - 2030 (USD Million) (Kilotons)
TABLE 97 Central & South America iron casting market estimates & forecasts, by product, 2018 - 2030 (USD Million)
TABLE 98 Central & South America iron casting market estimates & forecasts, by product, 2018 - 2030 (Kilotons)
TABLE 99 Central & South America iron casting market estimates & forecasts, by application, 2018 - 2030 (USD Million)
TABLE 100 Central & South America iron casting market estimates & forecasts, by application, 2018 - 2030 (Kilotons)
TABLE 101 Brazil iron casting market estimates & forecasts, 2018 - 2030 (USD Million) (Kilotons)
TABLE 102 Brazil iron casting market estimates & forecasts, by product, 2018 - 2030 (USD Million)
TABLE 103 Brazil iron casting market estimates & forecasts, by product, 2018 - 2030 (Kilotons)
TABLE 104 Brazil iron casting market estimates & forecasts, by application, 2018 - 2030 (USD Million)
TABLE 105 Brazil iron casting market estimates & forecasts, by application, 2018 - 2030 (Kilotons)
TABLE 106 Argentina iron casting market estimates & forecasts, 2018 - 2030 (USD Million) (Kilotons)
TABLE 107 Argentina iron casting market estimates & forecasts, by product, 2018 - 2030 (USD Million)
TABLE 108 Argentina iron casting market estimates & forecasts, by product, 2018 - 2030 (Kilotons)
TABLE 109 Argentina iron casting market estimates & forecasts, by application, 2018 - 2030 (USD Million)
TABLE 110 Argentina iron casting market estimates & forecasts, by application, 2018 - 2030 (Kilotons)
TABLE 111 Middle East & Africa iron casting market estimates & forecasts, 2018 - 2030 (USD Million) (Kilotons)
TABLE 112 Middle East & Africa iron casting market estimates & forecasts, by product, 2018 - 2030 (USD Million)
TABLE 113 Middle East & Africa iron casting market estimates & forecasts, by product, 2018 - 2030 (Kilotons)
TABLE 114 Middle East & Africa iron casting market estimates & forecasts, by application, 2018 - 2030 (USD Million)
TABLE 115 Middle East & Africa iron casting market estimates & forecasts, by application, 2018 - 2030 (Kilotons)
TABLE 116 South Africa iron casting market estimates & forecasts, 2018 - 2030 (USD Million) (Kilotons)
TABLE 117 South Africa iron casting market estimates & forecasts, by product, 2018 - 2030 (USD Million)
TABLE 118 South Africa iron casting market estimates & forecasts, by product, 2018 - 2030 (Kilotons)
TABLE 119 South Africa iron casting market estimates & forecasts, by application, 2018 - 2030 (USD Million)
TABLE 120 South Africa iron casting market estimates & forecasts, by application, 2018 - 2030 (Kilotons)


List of Figures

FIG. 1 Market segmentation
FIG. 2 Information procurement
FIG. 3 Data analysis models
FIG. 4 Market formulation and validation
FIG. 5 Data validating & publishing
FIG. 6 Market snapshot
FIG. 7 Segmental outlook
FIG. 8 Competitive outlook
FIG. 9 Iron casting market outlook, 2018 - 2030 (USD Million)
FIG. 10 Value chain analysis
FIG. 11 Market dynamics
FIG. 12 Porter’s analysis
FIG. 13 PESTEL analysis
FIG. 14 Iron casting market, by product: Key takeaways
FIG. 15 Iron casting market, by product: Market share, 2024 & 2030
FIG. 16 Iron casting market, by application: Key takeaways
FIG. 17 Iron casting market, by application: Market share, 2024 & 2030
FIG. 18 Iron casting market: Regional analysis, 2024
FIG. 19 Iron casting market, by region: Key takeaways

FAQ'S

For a single, multi and corporate client license, the report will be available in PDF format. Sample report would be given you in excel format. For more questions please contact:

sales@marketinsightsresearch.com

Within 24 to 48 hrs.

You can contact Sales team (sales@marketinsightsresearch.com) and they will direct you on email

You can order a report by selecting payment methods, which is bank wire or online payment through any Debit/Credit card, Razor pay or PayPal.