U.S. Cleanroom Cleaning Products Market Size, Share & Trends Analysis Report, By Product (Cleaning Chemicals, Supplies & Accessories), By End Use (Pharmaceutical & BioTechnology, Medical Device Manufacturing), And Segment Forecasts

U.S. Cleanroom Cleaning Products Market Size, Share & Trends Analysis Report, By Product (Cleaning Chemicals, Supplies & Accessories), By End Use (Pharmaceutical & BioTechnology, Medical Device Manufacturing), And Segment Forecasts,

Published Date: April - 2025 | Publisher: MIR | No of Pages: 220 | Industry: consumer and goods | Format: Report available in PDF / Excel Format

View Details Buy Now 2999 Download Free Sample Ask for Discount Request Customization

Market Size & Trends

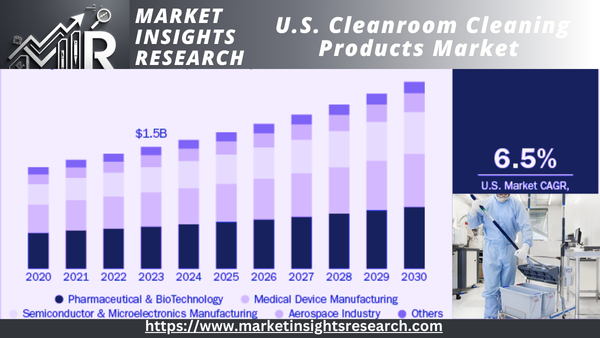
The size of the U.S. cleanroom cleaning chemicals market was USD 1,555.0 million in 2024 and is anticipated to grow at a CAGR of 6.5% from 2025 to 2035. The growth is being stimulated mainly due to the higher demand from pharmaceutical, biotech, and medical device manufacturing industries. Cleanrooms have stringent cleaning standards to meet the requirements for sterile conditions, and it has helped to increase the demand for special cleaning chemicals, consumables, and accessories substantially.

U.S. Cleanroom Cleaning Products Market

 Download Sample  Ask for Discount  Request Customization 

The U.S. biotechnology and pharmaceutical sectors are experiencing tremendous capacity growth, especially in the areas of vaccine manufacturing, gene therapies, and biologics. Plants producing these next-generation therapies are subject to cGMP (current Good Manufacturing Practices) and FDA regulations, which require the frequent utilization of ISO-classified cleanrooms. Cleaning solutions-like sterile wipes, disinfectants, and USP <797>- and USP <800>-compliant mopping systems are crucial for the preservation of microbial control. For example, Moderna's mRNA vaccine plants and Pfizer's gene therapy production lines utilize multi-level cleanroom cleaning procedures involving validated and residue-free cleaning materials.

The CHIPS and Science Act of 2022 has spurred local investment in the production of semiconductors, with firms like Intel, TSMC, and Micron establishing new fabs in Arizona, Ohio, and Texas. Semiconductor fabs are run at ISO Class 1-5 levels, where even submicron particles can degrade production yields. This requires the use of highly specialized cleanroom mops, tacky mats, isopropyl alcohol-based agents, and lint-free wipes that are silicon-free and non-shedding.

Tightening of standards by regulatory agencies like the U.S. Food and Drug Administration (FDA) and the International Organization for Standardization (ISO) necessitates strict contamination control practices in cleanroom operations. ISO 14644-1 Cleanrooms and Associated Controlled Environments Part 1 specifies cleanliness based on levels from ISO Class 1 to ISO Class 9, regarding how ISO cleanroom cleanliness standards are applicable. The cleanroom class refers to the level of cleanliness that the room meets, based on the size and number of particles per cubic meter of air. The Food and Drug Administration (FDA) also has strict standards for the cleanroom cleaning using Current Good Manufacturing Practices (cGMP) to maintain the purity and safety of drugs. It requires the producers to have Standard Operating Procedures (SOPs) that involve cleaning processes on all equipment and surfaces.

Keeping up with the standards requires the companies to make investments in clean, validated, high-quality products for cleaning which are compatible with aseptic manufacturing practices. Increased development in advanced manufacturing technology, including for semiconductor fabrication and nanotechnology, is driving need for ultra-clean environments, yet again benefiting the demand for specific cleanroom cleaning products.

The growth of modular and flexible cleanroom structures, which tend to be applied in temporary or quickly growing buildings like pharmaceutical and biotechnology as a result of their construction speed, flexibility, and scalability. These modular systems enhance the requirement for adaptable, simple-to-integrate cleaning chemicals that accommodate a range of cleanroom classes and configurations. As the industries keep on developing and focusing on contamination control, the American cleanroom cleaning products market is likely to experience long-term growth, innovation, and product diversification. One of the recent key innovations by Contec is the QuicKlean™ Mopping System, specifically designed for compounding pharmacies and cleanroom applications. The system includes disposable microfiber mop covers which are washed for hygiene and can be used with a variety of disinfectants. The QuicKlean system is intended for application in ISO Class 7 and 8 environments, with low-lint construction and high cleaning efficiency for wet and dry applications.

Report Coverage & Deliverables

PDF report & online dashboard will help you understand

  • Competitive benchmarking
  • Historical data & forecasts
  • Company revenue shares
  • Regional opportunities
  • Latest trends & dynamics

Product Insights

Market Analysis

 Download Sample  Ask for Discount  Request Customization 

Cleaning chemicals contributed to a market share of 59.4% of the total U.S. cleanroom cleaning products market in 2024. The U.S. demand for cleaning chemicals in the cleanroom cleaning products market is growing as a result of the increased requirement for rigid contamination control in critical applications including pharmaceuticals, biotechnology, and medical device manufacturing. As these markets expand, with their growth sparked by advances in drug development, biologics, and the emerging field of personalized medicine, standards for cleanliness and sterility have tightened up. Regulatory authorities like the FDA and ISO necessitate validated clean-in-place schemes that are entirely dependent on use-specific chemicals such as disinfectants, sporicides, and alcohol-containing agents.

Demand for accessories & supplies in the U.S. cleanroom cleaning products market is anticipated to increase at a CAGR of 7.0% during the period 2025-2035. There is growing demand for effective, disposable, and easy-to-use solutions that improve operational hygiene and minimize contamination risks. With increasing cleanroom facilities, especially in the pharmaceutical, biotech, and semiconductor industries, there is a rising trend towards using pre-validated consumables such as sterile wipes, gloves, gowns, mops, and sticky mats. These are critical to uphold cleanroom protocols without cross-contamination, especially in high-throughput environments.

End Use Insights

Pharmaceutical & BioTechnology held a share of 34.5% of the total U.S. cleanroom cleaning products market in 2024. Sudden growth in drug development, biologics cell, and gene therapies necessitate highly controlled and sterile manufacturing conditions. With increasing growth in these industries due to an aging population, increased chronic diseases, and increased global health consciousness, manufacturers are increasing production capacities and establishing new cleanroom facilities to maintain regulatory compliance and product safety.

Semiconductor and Microelectronics manufacturing demand in the U.S. cleanroom cleaning products market is anticipated to increase at a CAGR of 7.7% during the period from 2025 to 2035. With advancements in semiconductor technology due to the growing need for smaller, more sophisticated, and high-performance electronic devices, chip complexity and miniaturization necessitate even tighter control of cleanroom environments to avoid contamination, which leads to defects in microelectronic components. With the increased dependency on semiconductors in various industries including automotive, consumer electronics, and telecom, the demand for sophisticated cleanroom solutions and consumables has also increased. Comprises high-tech cleaning chemicals, wipes, gloves, and other accessories engineered to provide the rigorous cleanliness level of semiconductor production.

Suppliers & Accessories in the U.S. cleanroom cleaning products market is expected to grow at a CAGR of 7.0% between 2025 and 2030. Rising demand for highly controlled, contamination-free environments needed for the latest chip manufacturing necessitates cleanroom supplies like particle-free wipes, antistatic gloves, gowns, and sticky mats. These ultra-sensitive surroundings where even micro-scopic contamination may jeopardize production yields need these supplies. The tendency towards denser and more powerful microchips also increases the demand for stricter cleanliness controls, speeding the development of precision-designed consumables guaranteeing product quality and process reliability.

Key U.S. Cleanroom Cleaning Products Company Insights

The U.S. cleanroom cleaning products market is concentrated primarily due to the presence of several globally recognized players as well as regional players. Some prominent companies in the U.S. cleanroom cleaning products industry are Kimberly-Clark Corporation, Ecolab Life Sciences, 3M, Clean Air Technology, Inc., Mecart, Abtech Inc., and others.

  • Kimberly-Clark Corporation is a multinational company that manufactures and sells consumer and professional products, with a focus on paper-based products. They are known for brands like Kleenex, Huggies, Cottonelle, and Scott. Kimberly-Clark Professional offers a variety of products specifically designed for cleanroom cleaning and contamination control, including wipes, gloves, apparel, and hand hygiene solutions.

  • Ecolab Life Sciences is a division of Ecolab, a global leader in water, hygiene, and energy technologies. It focuses on providing cleaning, sanitation, and contamination control solutions for pharmaceutical and personal care manufacturers. Ecolab Life Sciences offers a wide range of solutions, including cleaning and disinfection chemistry, equipment, and Bioquell vaporized hydrogen peroxide decontamination. They work with customers in pharmaceutical, cleanroom, and personal care manufacturing to optimize production performance, mitigate risks, and ensure business continuity.

Key U.S. Cleanroom Cleaning Products Companies

Recent Developments

  • In March 2025, Kimberly-Clark Professional introduced Onvation® SmartFit™ technology, a compact, internet-enabled sensor designed to fit inside paper towels and bath tissue dispensers. This innovation provides real-time data to help commercial facility managers schedule janitorial staff more efficiently, reduce waste, and improve the guest experience. The sensor tracks product levels and restroom traffic, offering predictive data-based insights to eliminate guesswork from restroom servicing.

  • In January 2025, 3M reported higher-than-expected fourth-quarter profits due to increased demand for industrial adhesives, tapes, and electronics. The company projected 2025 adjusted profits in alignment with Wall Street estimates, focusing on a cost-cutting restructuring initiative and high-margin products. Notably, 3M announced plans to spin off its healthcare division, Solventum Corporation, as part of its strategic restructuring. The company also emphasized new product development, contributing to a 32% increase in product launches.

U.S. Cleanroom Cleaning Products Market Report Scope

Report Attribute

Details

Market revenue in 2025

USD 1,649.0 million

Revenue forecast in 2030

USD 2,258.4 million

Growth rate (Revenue)

CAGR of 6.5% from 2025 to 2030

Actuals

2018 - 2024

Forecast period

2025 - 2030

Quantitative units

Revenue in USD million and CAGR from 2025 to 2030

Report coverage

Revenue forecast, company ranking, competitive landscape, growth factors, and trends

Segments covered

Product, end use

Country scope

U.S.

Key companies profiled

Kimberly-Clark Corporation; Ecolab Life Sciences; 3M; Clean Air Technology, Inc.; Mecart; Abtech Inc.; Atmos Tech Industries; MayAir Group; S. C. Johnson & Son; Contech, Inc.

Customization

Free report customization (equivalent up to 8 analysts working days) with purchase. Addition or alteration to country, regional & segment scope.

Pricing and purchase options

Avail customized purchase options to meet your exact research needs. Explore purchase options

 Download Sample  Ask for Discount  Request Customization 

U.S. Cleanroom Cleaning Products Market Report Segmentation

This report forecasts revenue growth at the country level and provides an analysis of the latest industry trends and opportunities in each of the sub-segments from 2018 to 2035. For the purpose of this study, Grand View Research has segmented the U.S. cleanroom cleaning products market based on product and end use

  • Product Outlook (Revenue, USD Million, 2018 - 2030)

    • Cleaning Chemicals

    • Supplies & Accessories

      • Wipes

      • Mops & Sleeves

        • Disposable

        • Reusable

      • Trolleys/Bucket Systems

      • Bucket, Boxes, & Trays

      • Gloves & Safety Kit

      • Matting

      • Others (Reusable wipes, Waste bins, Brooms & brushes, Scrubbing pad, Spill pads, Swabs, etc.)

  • End Use Outlook (Revenue, USD Million, 2018 - 2030)

    • Pharmaceutical & BioTechnology

    • Medical Device Manufacturing

    • Semiconductor and Microelectronics Manufacturing

    • Aerospace Industry

    • Others (Optics & Photonics, Disk Drive Manufacturing, Automotive Industry, Nanotech R&D, etc.)

Table of Content

Chapter 1. Methodology and Scope
                    1.1. Market Segmentation & Scope
                    1.2. Market Definition
                    1.3. Information Procurement
                        1.3.1. Purchased Database
                        1.3.2. GVR’s Internal Database
                        1.3.3. Secondary Sources & Third-Party Perspectives
                        1.3.4. Primary Research
                    1.4. Information Analysis
                        1.4.1. Data Analysis Models
                    1.5. Market Formulation & Data Visualization
                    1.6. Data Validation & Publishing
Chapter 2. Executive Summary
                    2.1. Market Snapshot
                    2.2. Product Snapshot
                    2.3. End Use Snapshot
                    2.4. Segment Snapshot
                    2.5. Competitive Landscape Snapshot
Chapter 3. U.S. Cleanroom Cleaning Products Market: Industry Outlook
                    3.1. Market Lineage Outlook
                        3.1.1. Parent Market Outlook
                    3.2. Industry Value Chain Analysis
                        3.2.1. Sales Channel Analysis
                    3.3. Market Dynamics
                        3.3.1. Market Driver Analysis
                        3.3.2. Market Restraint Analysis
                        3.3.3. Market Opportunities
                        3.3.4. Market Challenges
                    3.4. Industry Analysis Tools
                        3.4.1. Porter’s Five Forces Analysis
                    3.5. Market Entry Strategies
Chapter 4. U.S. Cleanroom Cleaning Products Market: Product Estimates & Trend Analysis
                    4.1. U.S. Cleanroom Cleaning Products Market, By Product: Key Takeaways
                    4.2. Product Movement Analysis & Market Share, 2024 & 2030
                    4.3. Market Estimates & Forecasts, By Type, 2018 - 2030 (USD Million)
                        4.3.1. Cleaning Chemicals
                            4.3.1.1. Market estimates and forecast, 2018 - 2030 (USD Million)
                        4.3.2. Supplies & Accessories
                            4.3.2.1. Market estimates and forecast, 2018 - 2030 (USD Million)
                            4.3.2.2. Wipes
                                4.3.2.2.1. Market estimates and forecast, 2018 - 2030 (USD Million)
                                4.3.2.2.2. Disposable
                                    4.3.2.2.2.1. Market estimates and forecast, 2018 - 2030 (USD Million)
                                4.3.2.2.3. Reusable
                                    4.3.2.2.3.1. Market estimates and forecast, 2018 - 2030 (USD Million)
                            4.3.2.3. Mopes & Sleeves
                                4.3.2.3.1. Market estimates and forecast, 2018 - 2030 (USD Million)
                            4.3.2.4. Trolley/Bucket Systems
                                4.3.2.4.1. Market estimates and forecast, 2018 - 2030 (USD Million)
                            4.3.2.5. Bucket, Boxes, & Trays
                                4.3.2.5.1. Market estimates and forecast, 2018 - 2030 (USD Million)
                            4.3.2.6. Gloves & Safety Kit
                                4.3.2.6.1. Market estimates and forecast, 2018 - 2030 (USD Million)
                            4.3.2.7. Matting
                                4.3.2.7.1. Market estimates and forecast, 2018 - 2030 (USD Million)
                            4.3.2.8. Others
                                4.3.2.8.1. Market estimates and forecast, 2018 - 2030 (USD Million)
Chapter 5. U.S. Cleanroom Cleaning Products Market: End Use Estimates & Trend Analysis
                    5.1. U.S. Cleanroom Cleaning Products Market, By End Use: Key Takeaways
                    5.2. End Use Movement Analysis & Market Share, 2024 & 2030
                    5.3. Market Estimates & Forecasts, By End Use, 2018 - 2030 (USD Million)
                        5.3.1. Pharmaceutical & BioTechnology
                            5.3.1.1. Market estimates and forecast, 2018 - 2030 (USD Million)
                        5.3.2. Medical Device Manufacturing
                            5.3.2.1. Market estimates and forecast, 2018 - 2030 (USD Million)
                        5.3.3. Semiconductor and Microelectronics Manufacturing
                            5.3.3.1. Market estimates and forecast, 2018 - 2030 (USD Million)
                        5.3.4. Aerospace Industry
                            5.3.4.1. Market estimates and forecast, 2018 - 2030 (USD Million)
                        5.3.5. Others
                            5.3.5.1. Market estimates and forecast, 2018 - 2030 (USD Million)
Chapter 6. U.S. Cleanroom Cleaning Products Market: Competitive Analysis
                    6.1. Recent Developments & Impact Analysis, by Key Market Participants
                    6.2. Company Categorization
                    6.3. Participant’s Overview
                    6.4. Financial Performance
                    6.5. Product Benchmarking
                    6.6. Company Market Share Analysis, 2024 (%)
                    6.7. Company Heat Map Analysis
                    6.8. Strategy Mapping
                    6.9. Company Profiles
                        6.9.1. Kimberly-Clark Corporation
                            6.9.1.1. Company Overview
                            6.9.1.2. Financial Performance
                            6.9.1.3. Product Portfolios
                            6.9.1.4. Strategic Initiatives
                        6.9.2. Ecolab Life Sciences
                            6.9.2.1. Company Overview
                            6.9.2.2. Financial Performance
                            6.9.2.3. Product Portfolios
                            6.9.2.4. Strategic Initiatives
                        6.9.3. 3M
                            6.9.3.1. Company Overview
                            6.9.3.2. Financial Performance
                            6.9.3.3. Product Portfolios
                            6.9.3.4. Strategic Initiatives
                        6.9.4. Clean Air Technology, Inc.
                            6.9.4.1. Company Overview
                            6.9.4.2. Financial Performance
                            6.9.4.3. Product Portfolios
                            6.9.4.4. Strategic Initiatives
                        6.9.5. Mecart
                            6.9.5.1. Company Overview
                            6.9.5.2. Financial Performance
                            6.9.5.3. Product Portfolios
                            6.9.5.4. Strategic Initiatives
                        6.9.6. Abtech Inc.
                            6.9.6.1. Company Overview
                            6.9.6.2. Financial Performance
                            6.9.6.3. Product Portfolios
                            6.9.6.4. Strategic Initiatives
                        6.9.7. Atmos Tech Industries
                            6.9.7.1. Company Overview
                            6.9.7.2. Financial Performance
                            6.9.7.3. Product Portfolios
                            6.9.7.4. Strategic Initiatives
                        6.9.8. MayAir Group
                            6.9.8.1. Company Overview
                            6.9.8.2. Financial Performance
                            6.9.8.3. Product Portfolios
                            6.9.8.4. Strategic Initiatives
                        6.9.9. S. C. Johnson & Son
                            6.9.9.1. Company Overview
                            6.9.9.2. Financial Performance
                            6.9.9.3. Product Portfolios
                            6.9.9.4. Strategic Initiatives
                        6.9.10. Contech, Inc.
                            6.9.10.1. Company Overview
                            6.9.10.2. Financial Performance
                            6.9.10.3. Product Portfolios
                            6.9.10.4. Strategic Initiatives


List of Tables

Table 1. U.S. cleanroom cleaning products market: Key market driver analysis
Table 2. U.S. cleanroom cleaning products market: Key market restraint analysis
Table 3. U.S. cleanroom cleaning products market estimates & forecast, 2018 - 2030, by product, 2018 - 2030 (USD Million)
Table 4. U.S. cleanroom cleaning chemicals market estimates & forecast, 2018 - 2030 (USD Million)
Table 5. U.S. cleanroom cleaning supplies & accessories market estimates & forecast, 2018 - 2030 (USD Million)
Table 6. U.S. cleanroom cleaning wipes market estimates & forecast, 2018 - 2030 (USD Million)
Table 7. U.S. cleanroom cleaning mopes & sleeves market estimates & forecast, 2018 - 2030 (USD Million)
Table 8. U.S. cleanroom cleaning mopes & sleeves market estimates & forecast, by type, 2018 - 2030 (USD Million)
Table 9. U.S. cleanroom cleaning disposable mopes & sleeves market estimates & forecast, 2018 - 2030 (USD Million)
Table 10. U.S. cleanroom cleaning reusable mopes & sleeves market estimates & forecast, 2018 - 2030 (USD Million)
Table 11. U.S. cleanroom cleaning trolleys/bucket systems candle market estimates & forecast, 2018 - 2030 (USD Million)
Table 12. U.S. cleanroom cleaning bucket, boxes, & trays market estimates & forecast, 2018 - 2030 (USD Million)
Table 13. U.S. cleanroom cleaning gloves & safety kit market estimates & forecast, 2018 - 2030 (USD Million)
Table 14. U.S. cleanroom cleaning matting market estimates & forecast, 2018 - 2030 (USD Million)
Table 15. U.S. cleanroom cleaning others market estimates & forecast, 2018 - 2030 (USD Million)
Table 16. U.S. cleanroom cleaning products market estimates & forecast, 2018 - 2030, by end use, (USD Million)
Table 17. U.S. cleanroom cleaning products market estimates & forecast for pharmaceutical & biotechnology, 2018 - 2030 (USD Million)
Table 18. U.S. cleanroom cleaning products market estimates & forecast for medical device manufacturing, 2018 - 2030 (USD Million)
Table 19. U.S. cleanroom cleaning products market estimates & forecast for semiconductors and microelectronics manufacturing, 2018 - 2030 (USD Million)
Table 20. U.S. cleanroom cleaning products market estimates & forecast for the aerospace industry, 2018 - 2030 (USD Million)
Table 21. U.S. cleanroom cleaning products estimates & forecast for other, 2018 - 2030 (USD Million)
Table 22. Recent developments & impact analysis, by key market participants
Table 23. Company market share, 2024 (%)
Table 24. Company heat map analysis, 2024
Table 25. Companies implementing key strategies


List of Figures

Fig. 1 US Cleanroom cleaning products market segmentation
Fig. 2 Information procurement
Fig. 3 Primary research pattern
Fig. 4 Primary research approaches
Fig. 5 Primary research process
Fig. 6 Market snapshot
Fig. 7 Segment snapshot
Fig. 8 Regional snapshot
Fig. 9 Competitive landscape snapshot
Fig. 10 Parent industry and U.S. cleanroom cleaning products market size, 2024 (USD Million)
Fig. 11 U.S. cleanroom cleaning products market: Value chain analysis
Fig. 12 U.S. cleanroom cleaning products market: Dynamics
Fig. 13 U.S. cleanroom cleaning products market: Porter’s five forces analysis
Fig. 14 U.S. cleanroom cleaning products market, by product: Key takeaways
Fig. 15 U.S. cleanroom cleaning products market: Product movement analysis, 2024 & 2030 (%)
Fig. 16 U.S. cleanroom cleaning chemicals market estimates & forecast, 2018 - 2030 (USD Million)
Fig. 17 U.S. cleanroom cleaning supplies & accessories market estimates & forecast, 2018 - 2030 (USD Million)
Fig. 18 U.S. cleanroom cleaning mopes & sleeves market estimates & forecast, 2018 - 2030 (USD Million)
Fig. 19 U.S. cleanroom cleaning disposable mopes & sleeves market estimates & forecast, 2018 - 2030 (USD Million)
Fig. 20 U.S. cleanroom cleaning reusable mopes & sleeves market estimates & forecast, 2018 - 2030 (USD Million)
Fig. 21 U.S. cleanroom cleaning trolley/bucket systems market estimates & forecast, 2018 - 2030 (USD Million)
Fig. 22 U.S. cleanroom cleaning bucket, boxes, & trays market estimates & forecast, 2018 - 2030 (USD Million)
Fig. 23 U.S. cleanroom cleaning gloves & safety kit market estimates & forecast, 2018 - 2030 (USD Million)
Fig. 24 U.S. cleanroom cleaning matting market estimates & forecast, 2018 - 2030 (USD Million)
Fig. 25 U.S. cleanroom cleaning other market estimates & forecast, 2018 - 2030 (USD Million)
Fig. 26 U.S. cleanroom cleaning products market, by end use: Key takeaways
Fig. 27 U.S. cleanroom cleaning products market: End use movement analysis, 2024 & 2030 (%)
Fig. 28 U.S. cleanroom cleaning products market estimates & forecast for pharmaceutical & biotechnology, 2018 - 2030 (USD Million)
Fig. 29 U.S. cleanroom cleaning products market estimates & forecast for medical device manufacturing, 2018 - 2030 (USD Million)
Fig. 30 U.S. cleanroom cleaning products market estimates & forecast for semiconductors and microelectronics manufacturing, 2018 - 2030 (USD Million)
Fig. 31 U.S. cleanroom cleaning products market estimates & forecast for the aerospace industry, 2018 - 2030 (USD Million)
Fig. 32 U.S. cleanroom cleaning products market estimates & forecast, for other markets, 2018 - 2030 (USD Million)
Fig. 33 Key company categorization
Fig. 34 Company market share analysis, 2024
Fig. 35 Strategic framework of the U.S. cleanroom cleaning products market

FAQ'S

For a single, multi and corporate client license, the report will be available in PDF format. Sample report would be given you in excel format. For more questions please contact:

sales@marketinsightsresearch.com

Within 24 to 48 hrs.

You can contact Sales team (sales@marketinsightsresearch.com) and they will direct you on email

You can order a report by selecting payment methods, which is bank wire or online payment through any Debit/Credit card, Razor pay or PayPal.