U.S. Group Health Insurance Market Trends
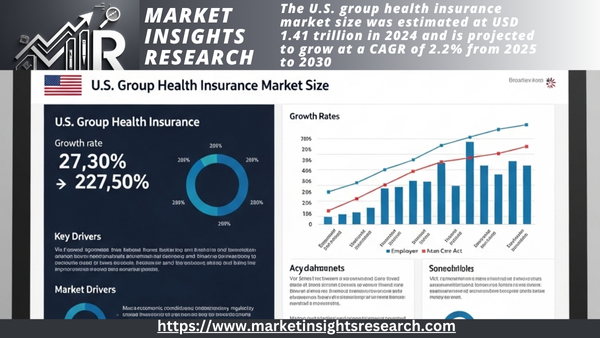
The size of the U.S. group health insurance market was estimated at USD 1.41 trillion in 2024 and is anticipated to increase at a CAGR of 2.2% during the period 2025–2030. The growing need for group health insurance, also referred to as employer-sponsored insurance, and its growing average premium cost have resulted in a dramatic increase in the market. Furthermore, the rising expenditure related to healthcare services and equipment, coupled with numerous government programs for enhanced public health, contributes extensively to the rising demand for group health insurance. These elements contribute to the broadened environment in which consumers are increasingly accessing medical care and assistance, contributing to increased group health insurance demand within the U.S.
As per the 2024 KFF Employer Health Benefits Survey, rising premium costs significantly drive the overall market, with averages reaching USD 8,951 for single coverage and USD 25,572 for family coverage. These high costs create financial pressure on both employers and employees, prompting companies to seek ways to manage and contain their expenses. Hence, many employers are considering strategies such as shifting more costs to employees, which may include increased deductibles or copayments, or adopting high-deductible health plans with savings options (HDHP/SOs). Currently, 27% of insured workers are under these plans, reflecting a shift toward models that place more financial responsibility on individuals.
Furthermore, the strong interest in Preferred Provider Organizations (PPOs) and High Deductible Health Plans/Health Savings Accounts (HDHP/SOs)—which cover 48% of insured workers—shows that people prefer insurance options that allow for more flexibility and possible savings. Overall, rising premiums and the increasing adoption of flexible health plans are shaping the future landscape of the U.S. group health insurance industry, influencing both employer strategies and employee options.
-
Health Risk Assessments (HRAs) 56% of large firms provided opportunities for employees to complete HRAs, which are questionnaires evaluating lifestyle, stress, and physical health factors.
-
Biometric Screenings 44% offered in-person health examinations conducted by medical professionals to measure risk factors such as cholesterol, blood pressure, and body mass index.
- Wellness Programs 79% implemented programs promoting healthy behaviors, including smoking cessation, weight management, and lifestyle coaching.
To encourage participation, many employers have introduced incentive structures
- Among large firms offering HRAs, 54% utilized incentives or penalties to motivate employees to complete the assessments.
- Similarly, 65% of large firms with biometric screening programs employed incentives to encourage employee participation.
These strategies reflect a broader trend where employers proactively address health issues and chronic conditions within their workforce. By investing in preventive care and wellness programs, companies aim to reduce long-term healthcare costs and enhance the overall health outcomes of their employees.

Moreover, the enrollment in health plans and the associated cost-sharing are significantly contributing to industry growth. Preferred Provider Organizations (PPOs) remain the most prevalent plan type, indicating a continued preference for flexible provider networks. High-Deductible Health Plans with Savings Options (HDHP/SOs) have gained traction, reflecting a shift toward plans that encourage cost-conscious healthcare decisions. This is influencing the group health insurance industry in the country by driving demand for plans that balance cost and flexibility. Employers are increasingly offering HDHP/SOs to manage rising healthcare expenses, while insurers are adapting their offerings to meet the evolving preferences of both employers and employees. The shift toward higher deductibles and cost-sharing mechanisms illustrates the importance of innovative plan designs that promote value-based care and employee engagement in health management.
Employer-Sponsore Coverage
|
Category |
Details |
Impact on U.S. Group Health Insurance Market |
|
Plan Types |
|
Preference for flexible plans (PPOs) and growth of consumer-driven plans (HDHP/SOs) reflecting cost-conscious healthcare choices. |
|
Average Deductible |
USD 1,787 for single coverage (steady from prior year, but 47% higher than 10 years ago) |
Higher deductibles encourage employees to be more engaged in healthcare spending decisions, driving demand for value-based care plans. |
|
Cost-SharingCoinsurance |
59% of workers’ pay coinsurance for hospital admissions, averaging 21% of costs |
Increasing coinsurance shifts more cost responsibility to employees, promoting selective use of healthcare services. |
|
Cost-SharingCopayments |
16% of workers have companions for hospital admissions, averaging USD 343 per admission |
Substantial copayments can affect how employees utilize healthcare services and choose their health plans. |
|
Out-of-Pocket Maximums |
|
Wide variation in maximum limits impacts financial risk exposure for employees and influences plan attractiveness. |
Market Concentration & Characteristics
The industry is experiencing a high degree of innovation, driven by the need for cost savings, improved member experience, and adaptability to changing regulatory landscapes. Innovations like zero-deductible and dynamic copay plans are introducing alternative member cost-sharing options to encourage members to use high-quality, lower-cost services. Alternative provider payment plans, including reference-based pricing, are also being adopted, offering savings of 10% to 30% for employers. In addition, risk-pooling products, such as group captives and association health plans, are allowing small and medium-sized employers to increase their bargaining power and enjoy benefits typically reserved for larger companies.
The market saw notable consolidations as larger operators sought to expand their reach and capabilities. For instance, in January 2024, Health Care Service Corporation (HCSC) completed its acquisition of The Cigna Group's Medicare Advantage, Medicare Supplemental Benefits, Medicare Part D, and CareAllies businesses. We expect the acquisition to broaden HCSC's capabilities and reach, especially in the expanding Medicare segment.
The industry is subject to a complex set of regulations that aim to ensure access to health coverage, affordability, and benefit adequacy. The primary regulatory bodies for group health plans include the Department of Labor (DOL), the Internal Revenue Service (IRS), and the Centers for Medicare & Medicaid Services (CMS). The Affordable Care Act (ACA) has played a significant role in driving the regulatory landscape, introducing provisions such as coverage for pre-existing conditions, extending dependent coverage, and eliminating lifetime and annual limits on essential health benefits. The ACA also established core market rules designed to expand coverage to most people in the U.S., including requirements for premium stabilization and other efforts to protect the risk pool.
Service expansion efforts are evident as companies aim to penetrate underserved markets across the U.S. through partnerships and strategic alliances. In April 2025, Sutter Health and SCAN Group announced a long-term strategic collaboration aimed at enhancing Medicare Advantage (MA) services in Northern California. This partnership plans to introduce new MA products in 2026 and aims to create a new joint venture MA health plan in the near future. The collaboration between Sutter Health and SCAN Group is designed to develop new care models that integrate technology, preventive health strategies, and comprehensive chronic disease management programs.
Plan Type Insights
The PPO plan segment held the largest revenue share of 49.46% in 2024 and is expected to grow at the fastest CAGR over the forecast period. Its dominance stems from its flexibility, broader provider network, and lower cost-sharing for in-network services. PPO plans do not require a primary healthcare barrier to screen for specialists and hospital visits, offering lower cost-sharing for in-network services. This flexibility is a significant factor in their popularity, as employees value the freedom to choose their healthcare providers. PPO plans offer a broader provider network compared to other plan types like Health Maintenance Organizations (HMOs). According to the Kaiser Family Foundation's (KFF) Employer Health Benefits 2024 Annual Survey Report, it remained the most common plan type, covering 48% of workers.
KFF Employer Health Benefits 2024 Annual Survey Report
Over the forecast period, we expect the High-Deductible Health Plans with a Savings Option (HDHP/SO) segment to grow at a significant CAGR. Its growth is attributed to the increasing healthcare costs, which have led employers to seek more cost-effective health insurance options. HDHP/SOs, which typically come with lower premiums but higher deductibles, have become an attractive alternative for employers looking to manage their healthcare expenses. Moreover, the rising trend of consumer-directed healthcare is strongly contributing to the growth of HDHP/Sos. This approach encourages employees to take a more active role in their healthcare spending by providing them with more transparency and control over their healthcare expenses. By pairing a high-deductible health plan with a savings option, such as a Health Savings Account (HSA), employees are incentivized to make more cost-conscious decisions about their healthcare.
Firm Size Insights
The large firm segment held the largest revenue share of 92.92%, in 2024. Its dominance is attributed to the increasing adoption of group health insurance among large firms, as it serves as a crucial employee benefit and a tool for attracting and retaining talent. Large firms often have more resources to devote to providing comprehensive health insurance to their employees, which can lead to better health outcomes and increased productivity. Large firms dominate the U.S. market for group health insurance, with over 90% of large businesses offering health insurance benefits to their employees, as large firms recognize the importance of providing comprehensive health insurance as a benefit to attract and retain top talent. Moreover, the regulatory environment also plays a role in driving the demand for group health insurance among large firms. The Affordable Care Act (ACA) requires employers with 50 or more full-time employees to offer health insurance or face penalties, which has led to increased adoption of group health insurance among large firms.
The small firm segment is expected to grow at a lucrative CAGR over the forecast period. Its growth is attributed to the increasing popularity of level-funded plans among small businesses. These plans offer a more predictable cost structure, which can help small firms better manage their health insurance expenses. Moreover, the size of a firm and its industry can significantly impact how sensitive it is to fluctuations in health insurance costs. For instance, smaller firms might have fewer resources to absorb rising insurance premiums, making their financial stability more vulnerable to changes in the market. Furthermore, the average deductible for employees at small businesses tends to be higher than that of larger companies. This distinction can affect employee satisfaction and retention, as higher out-of-pocket costs may deter potential talent from joining or staying with a small firm.
Regional And State Insights
The South region held the largest share of the U.S. market in 2024 due to the presence of noteworthy insurance plans and the substantial population covered by overall group health insurance. In terms of revenue share for the South in 2024, Florida State dominated. The fact that a sizable portion of the population in Florida has employer-sponsored coverage serves as the key supporting evidence. For instance, in Florida, approximately 38% (8.95 million people) of the population had employer-sponsored health insurance in 2023, according to the KFF's insurance coverage data.
Furthermore, the Midwest region continued to hold the second-largest share of the U.S. market for group health insurance, with the state of Illinois providing the greatest amount of revenue share in 2024. Over the forecast period, the market will continue to rise due to factors such as the adoption of group health insurance and cost/benefit analysis.

Key U.S. Group Health Insurance Company Insights
One of the major health insurers in the country is United Healthcare, a division of UnitedHealth Corporation (UHC). For all types of businesses, the program offers a variety of health insurance options, including specialty, additional dental, vision, pharmacy, and medical plans. KAISER FOUNDATION GRP, BCBS, and ANTHEM INC GRP are a few of the other providers holding a notable presence in the overall U.S. group health insurance market.
Companies in the U.S. group health insurance market have been implementing various techniques to retain their clients and expand their market presence. Although print advertising still exists, digital marketing has become one of the key tactics used. To increase market share, having a strong social media presence is invaluable, especially when combined with advertisement on relevant networks, such as Twitter, LinkedIn, etc.
Key U.S. Group Health Insurance Companies
- Health Care Service Corporation
- Unitedhealth Group
- Kaiser Foundation Health Plan, Inc.
- Blue Cross Blue Shield Association
- Anthem, Inc. (Now Elevance Health)
- The IHC Group
- Health Partners Group Ltd
- Mississippi Insurance Group, LLC
- Providence Health Plan
- Harvard Pilgrim Health Care, Inc.
Recent Developments
-
In March 2025, Transcarent, a digital health platform, completed its merger with Accolade, a virtual healthcare and benefits navigation company, in a deal worth USD 621 million. The combined organization will serve over 20 million Members and more than 1,700 employer and health plan clients, providing a comprehensive health and care experience
-
In June 2024, Alliant Insurance Services acquired HMS, a Tampa, Florida-based health insurance agency. HMS focuses on direct-to-consumer ACA plans, combining advanced data science and human expertise to help consumers make informed decisions about their healthcare. The acquisition marked Alliant's continued commitment to under-65 individual health insurance plans.
-
In April 2024, Pivot Health announced a partnership with Pan-American Life Insurance Group to launch SureCare STM, a proprietary short-term medical insurance product. We designed this product to offer individuals flexible and comprehensive options for health insurance coverage. This partnership is a strategic move to bring innovative health insurance products to the market
U.S. Group Health Insurance Market Report Scope
|
Report Attribute |
Details |
|
Revenue forecast in 2030 |
USD 1.61 trillion |
|
Growth rate |
CAGR of 2.2% from 2025 to 2030 |
|
Actual data |
2018-2024 |
|
Forecast data |
2025-2030 |
|
Quantitative units |
Revenue in USD million/billion and CAGR from 2025 to 2030 |
|
Report coverage |
Revenue forecast, company ranking, competitive landscape, growth factors, and trends |
|
Segments covered |
Plan type, firm size, region |
|
Regional scope |
Northeast, Midwest, South, West |
|
State scope |
50 states excluding District of Columbia & Puerto Rico |
|
Key companies profiled |
Health Care Service Corporation; Unitedhealth Group; Kaiser Foundation Health Plan, Inc.; Blue Cross Blue Shield Association; Anthem, Inc. (Now Elevance Health); The IHC Group; Health Partners Group Ltd.; Mississippi Insurance Group, LLC; Providence Health Plan; Harvard Pilgrim Health Care, Inc. |
|
Customization scope |
We offer free report customization, equivalent to up to 8 analysts' working days, with every purchase. Addition or alteration to country, regional & segment scope. |
|
Pricing and purchase options |
Avail yourself of customized purchase options to meet your exact research needs. Explore purchase options |
U.S. Group Health Insurance Market Report Segmentation
This report forecasts revenue growth at the country level and provides an analysis of the latest industry trends in each of the subsegments from 2018 to 2030. For this study, MIR has segmented the U.S. group health insurance market report based on plan type, firm size, and region.
-
Plan Type Outlook (Revenue, USD Billion, 2018-2030)
-
Health Maintenance Organization (HMO)
-
Preferred Provider Organization (PPO)
-
Point of Service (POS)
-
High-Deductible Health Plans with a Savings Option (HDHP/SO)
-
Conventional (Indemnity plans)
-
-
Firm Size Outlook (Revenue, USD Billion, 2018-2030)
-
Small Firm
-
Self-Funded Plan
-
Level-Funded Plan
-
Fully Insured
-
-
Large Firm
-
-
Region Outlook (Revenue, USD Billion, 2018-2030)
-
Northeast
-
Connecticut
-
Massachusetts
-
Pennsylvania
-
New Jersey
-
New York
-
Others
-
New Hampshire
-
Rhode Island
-
Vermont
-
Maine
-
-
-
Midwest
-
Illinois
-
Indiana
-
Michigan
-
Ohio
-
Wisconsin
-
Iowa
-
Kansas
-
Minnesota
-
Missouri
-
Nebraska
-
Others
-
North Dakota
-
South Dakota
-
-
-
West Group
-
Arizona
-
Colorado
-
Nevada
-
Utah
-
California
-
Oregon
-
Washington
-
Others
-
Idaho
-
Montana
-
New Mexico
-
Wyoming
-
Alaska
-
Hawaii
-
-
-
South
-
Florida
-
Georgia
-
Maryland
-
North Carolina
-
South Carolina
-
Virginia
-
Alabama
-
Kentucky
-
Tennessee
-
Louisiana
-
Oklahoma
-
Texas
-
Others
-
Delaware
-
West Virginia
-
Mississippi
-
Arkansas
-
-
-
Related Reports
FAQ'S
For a single, multi and corporate client license, the report will be available in PDF format. Sample report would be given you in excel format. For more questions please contact:
Within 24 to 48 hrs.
You can contact Sales team (sales@marketinsightsresearch.com) and they will direct you on email
You can order a report by selecting payment methods, which is bank wire or online payment through any Debit/Credit card, Razor pay or PayPal.
Discounts are available.
Hard Copy