Oral Solid Dosage CDMO Market Trends
Estimated at USD 43.65 billion in 2024, the worldwide market size for oral solid doses in contract development and manufacturing is expected to rise at a CAGR of 6.49% from 2025 to 2030. Rising consumption of oral solid dosages (OSDs) like pills and capsules, combined with high demand for them, should help increase general market demand.
Key Highlights
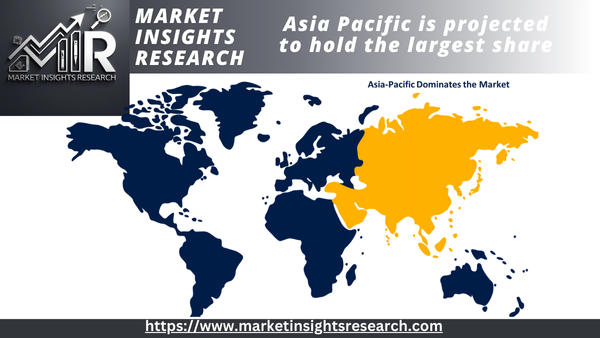
- Asia Pacific region dominated the global market in 2024 and accounted for the largest share of over 36.76% of the overall revenue
- The oral solid dosage CDMO market in the U.S. held the largest share in North American region
- Based on product, the tablet segment held the largest share, accounting for over 32.06% revenue share in 2024
- Based on mechanism, the controlled release segment dominated the market in 2024
- Based on end use, the medium & small-size companies segment dominated the global market in 2024 and is anticipated to witness the fastest growth over the analysis timeframe
In addition, high customer preference for OSD among the patient population, owing to ease of administration and precise dosage, propels market growth potential. Furthermore, a few other factors accelerating the industry’s progression include ongoing advancements in drug delivery technology, rising investments by contract development and manufacturing organizations (CDMOs) to expand OSD development, and increasing demand for novel therapies. Technological advancements in the development and bulk manufacturing of OSD forms are among the key factors supporting the fast-track commercialization of these products. Currently, several solid dosage forms are accessible in the market. In addition, the pharmaceutical/biopharmaceutical & nutraceutical industries consistently put effort into developing OSD forms. This preference is due to their convenient consumption, ease of handling, and patient adherence. Furthermore, projections indicate that technological and material advancements in OSD products will increase the demand for these formulations. The requirement for patient-centric dosage forms has increased in the past few years to improve medication adherence. Thus, integration of advanced technologies in facilities to cater to enhanced manufacturing and development capabilities with reduced cost and time.
Integration of 3D printing in OSD manufacturing can enable precise control over drug release and help customize dosage forms based on patient needs. This technology enables the production of complex forms and formulations, offering flexibility in drug design and manufacturing. Furthermore, advancements in controlled-release technologies can improve drug delivery by providing sustained and extended-release options. Such innovation enhances therapeutic efficacy and patient compliance. The adoption of digital technologies and data analytics in OSD manufacturing enhances process monitoring, quality control, and overall efficiency. CDMO leveraging these technologies provides transparent and data-driven solutions. Such advancements are likely to create growth opportunities in the market.
The growing prevalence of chronic and infectious diseases is one of the major factors driving the demand for novel therapies. In addition, the growing geriatric population is contributing to the rising incidence of chronic diseases, further supporting the demand for novel therapies. Another factor contributing to market growth is adverse drug reactions to existing drugs, which have increased the demand for novel treatment options.

Report Coverage & Deliverables
The PDF report & online dashboard will help you understand
- Competitive benchmarking
- Historical data & forecasts
- Company revenue shares
- Regional opportunities
- Latest trends & dynamics
Opportunity Analysis
The Oral Solid Dosage (OSD) CDMO market presents robust growth opportunities driven by increasing outsourcing trends, cost pressures, and evolving formulation complexity in the pharmaceutical industry. OSD forms, including tablets and capsules, remain the most widely prescribed drug formats globally, accounting for over 50% of total pharmaceutical consumption. As pharmaceutical companies seek to streamline operations and focus on core competencies such as drug discovery and commercialization, they increasingly outsource manufacturing to CDMOs with specialized expertise in OSD technologies. Growing demand for lifecycle management services, including reformulation, modified-release profiles, fixed-dose combinations, and pediatric or geriatric dosage adaptations, further intensifies this shift.
Emerging markets, particularly in Asia-Pacific and Latin America, offer cost advantages and expanding regulatory capabilities, creating regional hubs for global supply. Further, the rising number of small and virtual biopharma companies without in-house manufacturing infrastructure has intensified the demand for end-to-end CDMO partnerships. In addition, regulatory pressure in developed markets favors CDMOs with strong compliance track records and global GMP certifications. Technological advancements such as continuous manufacturing, high-potency containment, and 3D printing are unlocking new niches for innovation-focused CDMOs.
The generic and over-the-counter (OTC) segments also represent scalable opportunities, especially in high-volume markets like India, Brazil, and Eastern Europe. Amid rising drug shortages and geopolitical shifts, CDMOs that offer agility, dual-sourcing capabilities, and local-market supply solutions are gaining competitive traction. Looking forward, OSD-focused CDMOs that invest in flexible manufacturing lines, digital integration, and late-stage development services are well-positioned to capture long-term growth across both mature and emerging markets. Strategic collaborations, capacity expansion, and regulatory readiness will be key enablers for success in the evolving OSD CDMO landscape.
The OSD CDMO market is experiencing significant technological advancements enhancing drug development and manufacturing processes. Continuous manufacturing has emerged as a pivotal innovation, enabling uninterrupted production flows that improve efficiency, consistency, and cost-effectiveness. This approach reduces transfer steps and contamination risks by integrating multiple unit operations into a single process. In addition, 3D printing technologies, particularly 3D screen printing, are revolutionizing personalized medicine by allowing precise control over drug composition and dosage, facilitating the production of tailored medications for individual patient needs.
Advanced drug delivery systems, such as Self-Microemulsifying Drug Delivery Systems (SMEDDS), are improving the bioavailability of poorly soluble drugs and enhancing therapeutic efficacy. Furthermore, the integration of digital tools like predictive modeling and automation platforms accelerates formulation development, reducing time and resource requirements. These digital advancements enable rapid optimization of tablet formulations, ensuring critical quality attributes are met efficiently.
In the Oral Solid Dosage CDMO market, pricing models are pivotal in aligning client expectations with service delivery, risk-sharing, and long-term collaboration. Four key pricing structures are commonly employedmilestone-based, value-based, fixed-fee, and subscription/retainer models. Each offers strategic benefits depending on project complexity, client size, and engagement duration.
Milestone-based pricing is widely used for complex development or scale-up projects. Payments are linked to the achievement of defined technical or regulatory milestones, helping to mitigate risk for both CDMOs and sponsors. This model fosters accountability but can lead to negotiation complexity and extended timelines if milestone definitions are ambiguous. Value-based pricing is gaining traction as CDMOs aim to align compensation with the therapeutic or commercial value they help generate. This model ties pricing to improved bioavailability, faster time-to-market, or higher yields. It rewards innovation and performance but requires sophisticated metrics and trust between partners.
The fixed-fee model offers predictability, particularly for standardized tasks such as tablet compression or batch manufacturing. This model simplifies budgeting for sponsors and reduces administrative overhead; however, it may disincentivize flexibility and innovation in long-term projects. The subscription or retainer model is emerging for clients seeking ongoing development or manufacturing support. This approach involves recurring monthly or quarterly fees, enabling steady resource allocation and long-term partnership. While beneficial for capacity planning, it may be less suitable for sporadic or project-based clients.
Market Concentration & Characteristics
The market growth stage is medium, and the pace of the market growth is accelerating. The oral solid dosage CDMO market is characterized by a high degree of innovation. Regulations, service expansions, and regional expansions influence the level of M&A activities.
Degree of innovationThe oral solid dosage CDMO market is characterized by a high degree of innovation driven by continuous advancements in manufacturing technology, such as 3D printing, process analytical technology (PAT), and machine learning. Moreover, market participants are focusing on developing novel solutions and methodologies to improve the efficiency and effectiveness of product development processes, including personalized medicine, advanced drug delivery systems, and novel solutions.
Level of Merger & Acquisition (M&A) strategiesthe medium level of M&A in the oral solid dosage CDMO market, driven by the growing need for companies to expand their capabilities, geographic presence, and service offerings. For instance, in April 2023, NextPharma acquired a chewable tablets manufacturing facility from Takeda in Norway. This acquisition expanded the company’s operational capabilities in the market.
The impact of regulations on the oral solid dosage CDMO market is significant. The OSD CDMO market is highly influenced by regulatory requirements enforced by several regulatory authorities, such as the U.S. FDA and the EMA, among others. Stringent regulations regarding development and manufacturing standards, quality control, and documentation significantly impact overall market dynamics.
Service ExpansionsSeveral industry participants are undertaking collaborations and partnerships with pharmaceutical companies, research institutions, and technology providers to accelerate service expansions. For instance, in January 2023, Ethicann and Catalent collaborated for the development of Ethicann’s clinical drug pipeline by using Catalent’s ODT technology. Furthermore, investments in innovative technologies such as continuous manufacturing, automation, and data analytics enable CDMOs to provide greater efficiency and more cost-effective solutions to their clients, thereby driving overall market growth.
Regional ExpansionsThe oral solid dosage CDMO market is characterized by a medium impact of regional expansion driven by factors such as chronic disease burden, increasing healthcare expenditures, and high demand for OSD. Several service providers are broadening their presence in emerging markets, such as Asia, the Pacific, and Latin America, by establishing manufacturing and R&D facilities and strategic alliances with domestic players to gain market access and new revenue growth avenues.
Product Insights
The tablet segment held the largest share, accounting for over 32.06% of revenue in 2024. The segment is expected to retain its dominance over the forecast period due to its broad applicability, diverse formulations, patient preference, and global acceptance. Technological advancements, such as continuous manufacturing and 3D printing, are expected to improve segment growth by enhancing the efficiency of overall manufacturing processes in facilities. Moreover, strategic initiatives by key players such as capacity expansion, partnerships, and collaborations are projected to fuel market growth in the near future. For instance, in April 2023, Thermo Fisher Scientific expanded the capabilities of its Bourgoin, France site to incorporate early development activities for oral solid dose therapies, including tablets, capsules, and granules. This move enabled the company to seamlessly cater to customers’ workflow, from the initial stages of drug development to commercial manufacturing.
The capsules segment is predicted to witness the highest CAGR over the forecast period. The high segment growth is owing to numerous advantages, such as ease of swallowing, faster disintegration, taste masking, and absorption. In addition, increasing demand for encapsulated formulations, driven by the growing pharmaceutical sector worldwide, fuels the need for specialized CDMOs that are capable of delivering high-quality, customized hard gelatin capsules efficiently and cost-effectively.
Mechanism Insights
The controlled release segment dominated the market in 2024. Improved patient compliance, enhanced efficacy & safety, and reduced frequency of administration are some of the major factors expected to drive the segment over the forecast period. A growing number of CDMOs and CMOs is expected to fuel segmental growth over the forecast period by providing controlled-release oral solid dosage development and manufacturing services to address the ever-increasing chronic disease burden. Additionally, new technologies in controlled release methods, like multiparticulate systems and osmotic release, are increasing the demand for this segment.
The immediate release segment is expected to witness a higher CAGR over the forecast period. The segment growth is owing to increasing demand for rapid drug absorption and the onset of action among patients, fueling segment growth. Also, ongoing improvements in how drugs are made and formulated enable CDMOs to create immediate-release drugs that work better and are absorbed more effectively. Furthermore, the expanding pharmaceutical outsourcing trend and the outsourcing of immediate-release drug manufacturing by pharmaceutical companies to CDMOs are driving the growth of this market segment.
Drug Potency Insights
The low-potency drugs segment dominated the global market in 2024. Low-potency oral solid dosage manufacturing processes have widespread use and are relatively simpler than highly potent or complex formulations. As a result, there is a consistently high demand for CDMOs specializing in the production of low-potency oral solid dosage forms. The segment also caters to many therapeutic areas and patient populations, making it one of the most significant segments within the pharmaceutical industry. CDMOs focusing on this segment capture a substantial portion of the market share by offering cost-effective manufacturing solutions and meeting the diverse needs of pharmaceutical companies. The wide use of low-potency oral solid dosage forms in different treatment areas and markets creates a varied group of customers for CDMOs that focus on this area.
On the other hand, the high-potency drugs segment is anticipated to witness the fastest growth over the projected timeframe. The increasing demand for oncology drugs is a significant driver for the segment's growth. As the prevalence of cancer rises globally and demand for more targeted and personalized therapies increases, pharmaceutical companies are increasingly focusing on developing highly potent drugs to address unmet medical needs in oncology. Such attention has led to a surge in outsourcing to specialized CDMOs with the expertise and infrastructure required for safe handling & production of these potent compounds, enabling expedited development & commercialization of innovative oncology therapies. In June 2023, Aenova, a CDMO, opened a new facility for producing highly potent APIs in Germany, which enabled the company to increase its development and production capacities for cytostatics and cytotoxics to meet the growing market demand for these ingredients.
End Use Insights
The medium & small-sized companies segment dominated the global market in 2024 and is anticipated to witness the fastest growth over the analysis timeframe. Small and medium-sized companies are increasingly outsourcing their production work to CDMOs and CMOs, contributing to the segment's growth. Medium- and small-sized pharmaceutical companies have limited resources and capabilities in formulation development, process optimization, and manufacturing of oral solid dosage forms. Outsourcing allows them to access specialized expertise, advanced technologies, and state-of-the-art facilities offered by CDMOs without significant upfront investment. Increasing strategic initiatives by business players is another key factor contributing to segment growth. In August 2021, Recro Pharma, Inc., also known as Societal CDMO, acquired IRISYS, a U.S.-based CDMO involved in oral solid dosage contract development and manufacturing. This acquisition broadened the company’s business capabilities to cater diverse client base and fortify its financial position.
The medium- & small-size companies segment is expected to grow significantly over the forecast period. An increasing number of small and medium-sized companies are outsourcing their production work to CDMOs and CMOs, contributing to the segment's growth. Medium- and small-sized pharmaceutical companies have limited resources and capabilities in formulation development, process optimization, and manufacturing of oral solid dosage forms. Outsourcing allows them to access specialized expertise, advanced technologies, and state-of-the-art facilities offered by CDMOs without significant upfront investment. By partnering with CDMOs, these companies can leverage variable cost structures, optimize resource utilization, and reduce overall operational expenses, which enables them to allocate resources more efficiently and focus on core business activities.
Regional Insights
The Asia Pacific region dominated the global market in 2024 and accounted for the largest share of over 36.76% of the overall revenue. We also expect the region to grow at the fastest pace in the projected period. India and China are OSD CDMO powerhouses of the region, offering significantly lower prices. Due to the increasing patent expiration, generic drug manufacturing is the region’s second-largest revenue source. The Oral Solid Dosage CDMO Market in Asian countries such as India and China has grown due to improved social insurance schemes and economic conditions, enabling patients to afford out-of-pocket pharmaceutical costs. The expanding manufacturing capabilities in these countries have made them significant players in the pharmaceutical industry.
The oral solid -dose CDMO market in China held the largest share in Asia Pacific in 2024. We anticipate that China's market will continue to grow due to the increasing demand for superior quality and ongoing advancements in the pharmaceutical sector.
Over the forecast period, we expect the Japan oral solid dosage CDMO market to grow substantially. Rapid advancements in drug delivery technology, such as targeted drug delivery and sustained-release dosage forms, are some of the key factors accelerating overall market growth in the country.
The oral solid dosage CDMO market in India is anticipated to grow at the fastest CAGR over the forecast period. This can be attributed to low costs, the availability of industry experts, the presence of WHO-cGMP-compliant facilities, and high manufacturing capabilities of generic drugs and cost-effective oral solid dosage packaging solutions. As per June 2023 data by PIB, the country ranks third globally in terms of drugs and pharmaceuticals volume and exports to about 200 countries.
North America Oral Solid Dosage CDMO Market Trends
The oral solid dosage CDMO market of North America was estimated to have a substantial share in 2024 owing to growing investments in R&D of new drugs by pharmaceutical companies. The growth of the pharmaceutical industry in the U.S. and Canada is a key factor contributing to market growth. Furthermore, we anticipate that the substantial presence of key industry players and ongoing clinical trials will propel market growth.
The oral solid dosage CDMO market in the U.S. held the largest share in the North American region. Increasing R&D investments, growing drug development costs, expensive raw ingredients, and a rising need for oral solid dosage products are driving numerous pharmaceutical entities in the U.S. to outsource key aspects of the drug development process.
Europe Oral Solid Dosage CDMO market
Europe held the third-largest share of the global oral solid dosage CDMO market in 2024, owing to the presence of key pharmaceutical companies in this region. Europe has a robust pharmaceutical sector with numerous drug discovery, development, and manufacturing companies. These CDMOs are investing in upgrading existing capabilities to meet the rising demand, divesting their business segments to increase focus on one of the most crucial businesses, as well as investing in building new facilities to expand their market reach within the region.
The oral solid dosage CDMO market in Germany held the highest market share in Europe in 2024. Technological advancements in pharmaceutical drug product development by CDMOs in the region are a major factor responsible for market growth. The OSD CDMO industry significantly benefits from robust R&D initiatives, advanced early innovation medicine platforms, and numerous clinical trials targeting various disease challenges.
Over the estimated period, we anticipate substantial market growth in the UK oral solid dosage CDMO market. We anticipate that the presence of numerous multinational CDMOs in the UK will contribute to market growth. Moreover, the pharmaceutical manufacturers in the UK are focusing on the innovation of various high-value tablet forms in bulk, which has created a demand for oral solid dosage CDMOs in the country.
Key Oral Solid Dosage CDMO Company Insights
The key companies are implementing several market strategies, such as merger & acquisition, collaboration, regional expansion, service portfolio expansion, and competitive pricing, to sustain themselves in the competitive environment and acquire a higher market share. For instance, In January 2024, Alcami Corporation acquired Pacific Pharmaceutical Services, Inc., a cGMP pharma storage and services provider. Such acquisitions offered the company numerous growth opportunities in a significant market.
Key Oral Solid Dosage CDMO Companies
The following are the leading companies in the oral solid dosage CDMO market. These companies collectively hold the largest market share and dictate industry trends.
- Lonza
- Thermo Fisher Scientific Inc.
- Cambrex Corporation
- Catalent Inc.
- Siegrfried Holding AG
- Recipharm AB
- CordenPharma International
- Boehringer Ingel
- Piramal Pharma Solutions
- Aenova Group
- Almac Group
- Jubilant Pharmova Limited
- Delpharm
- AbbVie Contract Manufacturing
- Next Pharma AB
- Rubicon Research Pvt. Ltd.
- Quotient Sciences
- SPI Pharma
- DPT Laboratories Ltd.
- Alcami Corporation
Recent Developments
-
In February 2024, Novo Holdings announced the acquisition of Catalent Inc., a prominent CDMO in the healthcare industry. Through this acquisition, Novo Holdings will gain significant market growth opportunities, and Catalent will broaden its operational capabilities.
-
In July 2023, Aenova Group partnered with Galvita to improve the formulation, production, and development of oral dosage forms. This partnership helped to broaden the company’s service offerings in the market.
Oral Solid Dosage CDMO Market Report Scope
|
Report Attribute |
Details |
|
Market size value in 2025 |
USD 46.37 billion |
|
Revenue forecast in 2030 |
USD 63.50 billion |
|
Growth rate |
CAGR of 6.49% from 2025 to 2030 |
|
Historical data |
2018-2024 |
|
Forecast period |
2025-2030 |
|
Quantitative units |
Revenue in USD million/billion and CAGR from 2025 to 2030 |
|
Report coverage |
Revenue forecast, company ranking, competitive landscape, growth factors, and trends |
|
Segments covered |
Product, mechanism, drug potency, end use, region |
|
Regional scope |
North America; Europe; Asia Pacific; Latin America; MEA |
|
Country scope |
U.S.; Canada; Mexico; UK; Germany; France; Italy; Spain; Denmark; Sweden; Norway; China; India; Japan; Australia; Thailand; South Korea; Brazil; Argentina; Saudi Arabia; UAE; South Africa; Kuwait |
|
Key companies profiled |
Lonza; Thermo Fisher Scientific; Cambrex Corporation; Catalent Inc.; Siegfried Holding AG; Recipharm AB; CordenPharma International; Boehringer Ingelheim; Piramal Pharma Solutions; Aenova Group; Almac Group; Jubilant Pharmova Limited; Delpharm; AbbVie Contract Manufacturing; Next Pharma AB; Rubicon Research Pvt. Ltd.; Quotient Sciences; SPI Pharma; DPT Laboratories, Ltd.; Alcami Corporation |
|
Customization scope |
We offer free report customization, equivalent to up to 8 analysts' working days, with every purchase. The scope of the country, region, and segment can be expanded or altered. |
Global Oral Solid Dosage CDMO Market Report Segmentation
This report forecasts revenue growth at the global, regional, and country levels and provides an analysis of the latest industry trends in each of the sub-segments from 2018 to 2030. For the purpose of this study, MIR has segmented the global oral solid dosage contract development and manufacturing organization market report based on product, mechanism, drug potency, end use, and region
-
Product Outlook (Revenue, USD Million, 2018-2030)
-
Tablets
-
Compressed Tablets
-
Orally Disintegrating Tablets (ODT)
-
Chewable Tablets
-
Bi-layer or Tri-layer Tablets
-
Sublingual or Buccal Tablets
-
Others
-
-
Capsules
-
Hard Gelatin Capsules
-
Soft Gelatin Capsules
-
-
Powders
-
Granules
-
Others
-
-
Mechanism Outlook (Revenue, USD Million, 2018 - 2030)
-
Immediate Release
-
Delayed Release
-
Controlled Release
-
-
Drug Potency Outlook (Revenue, USD Million, 2018-2030)
-
High Potent Drugs
-
Moderately Potent Drugs
-
Low Potent Drugs
-
-
End Use Outlook (Revenue, USD Million, 2018 - 2030)
-
Large Size Companies
-
Medium & Small Size Companies
-
Others
-
-
Regional Outlook (Revenue, USD Million, 2018 - 2030)
-
North America
-
U.S.
-
Canada
-
Mexico
-
-
Europe
-
UK
-
Germany
-
France
-
Italy
-
Spain
-
Sweden
-
Norway
-
Denmark
-
-
Asia Pacific
-
Japan
-
China
-
India
-
South Korea
-
Australia
-
Thailand
-
-
Latin America
-
Brazil
-
Argentina
-
-
Middle East & Africa
-
South Africa
-
Saudi Arabia
-
UAE
-
Kuwait
-
-
Related Reports
FAQ'S
For a single, multi and corporate client license, the report will be available in PDF format. Sample report would be given you in excel format. For more questions please contact:
Within 24 to 48 hrs.
You can contact Sales team (sales@marketinsightsresearch.com) and they will direct you on email
You can order a report by selecting payment methods, which is bank wire or online payment through any Debit/Credit card, Razor pay or PayPal.
Discounts are available.
Hard Copy