Computational Pathology Market Size, Share & Trends Analysis Report By Component (Software, Services) By Application, By Technology (Natural Language Processing Models), By End-use (Hospitals & Diagnostic Labs), By Region, And Segment Forecasts

Computational Pathology Market Size, Share & Trends Analysis Report By Component (Software, Services) By Application, By Technology (Natural Language Processing Models), By End-use (Hospitals & Diagnostic Labs), By Region, And Segment Forecasts

Published Date: April - 2025 | Publisher: MRA | No of Pages: 240 | Industry: healthecare | Format: Report available in PDF / Excel Format

View Details Buy Now 3999 Download Sample Ask for Discount Request Customization

Computational Pathology Market Trends

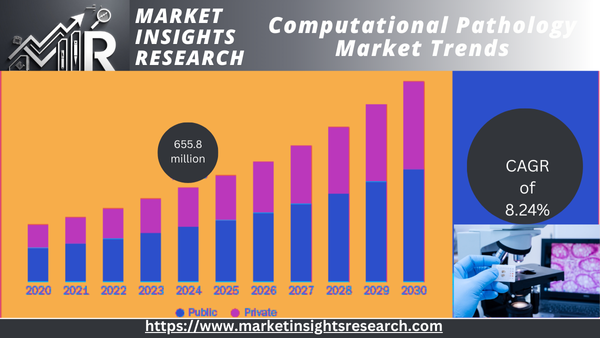
The size of the global computational pathology market was estimated to be USD 655.8 million in 2024 and is anticipated to expand at a CAGR of 8.24% from 2025 to 2030. This growth is driven by the increased adoption of machine learning and AI technologies, increased demand for enhanced solutions for rapid diagnosis, increasing chronic disease prevalence, and enhanced investment in healthcare by market players interested in developing advanced solutions. Additionally, the growing emphasis on drug discovery and increasing telepathology adoption also supports the market growth.

Computational Pathology Market

Download Sample  Ask for Discount  Request Customization 

The integration of machine learning and AI technologies into pathology workflows greatly revolutionizes the diagnostic process. For example, in October 2021, Tribun Health introduced CaloPix 5, a cutting-edge AI-driven computational pathology solution for diagnostics, prognosis, and drug development. The new-generation version of the image management system is augmented with capabilities like a completely web-based interface, high-volume storage management, and AI automation algorithms for breast, digestive, and lung cancer. The platform brings together different modules, such as tele-learning and formal reporting, to assist laboratories and pathologists in their digitalization.

The introduction of such solutions facilitates image analysis at a fast and accurate rate, which helps pathologists determine patterns that can suggest disease progression. Through automation of general tasks, AI allows pathologists to handle more advanced diagnostic challenges, improving efficiency and precision. This transformation improves diagnostic accuracy and aids in the creation of personalized medicine via predictive modeling.

In addition, the growing adoption and development of telepathology solutions are also adding to the market growth. Telepathology enables pathologists to consult cases and interact with colleagues from across geographical distances, thus increasing accessibility and improving the diagnostic process. The growth of these services has also been further boosted by the COVID-19 pandemic, which brought to the forefront the demand for remote healthcare solutions.

As healthcare organizations keep embracing telepathology to maximize resource utilization and enhance patient care, this trend will have a notable impact on the market growth. In June 2023, Zomedica Corp. revealed that it had launched its innovative TRUVIEW platform, an innovative diagnostic solution for the veterinary market. The telepathology and digital imaging aspects of this TRUVIEW platform and the firm's myZomedica web portal enable images to be sent to Zomedica pathologists to review and consult. The emergence of such solutions has further augmented the use of telepathology, thus boosting market growth.

Report Coverage & Deliverables

PDF report & online dashboard will enable you to
Understand competitive benchmarking
Gain insights into historical data & forecasts
Company revenue shares
Regional opportunities
Latest trends & dynamics
Request a Free Sample Copy
The Grand Library - BI Enabled Market Research Database
Click on image to enlarge

Case Study & Insights
Case StudyArtificial intelligence–aided cancer diagnosis enhances the productivity of pathologists in prostatic biopsies
This study assessed whether artificial intelligence (Paige Prostate) can enhance the diagnostic quality and productivity of pathologists while reading prostate core needle biopsy.

According to the findings, AI support enhanced accuracy in diagnosis, minimized turnaround time, and improved efficiency, assisting pathologists to make quicker and more uniform decisions.

Market Concentration & Features

The industry is witnessing an extremely high level of innovation as a result of various interconnected advances like Machine Learning (ML), Deep Learning, Natural Language Processing (NLP) models, and Computer Vision. The implementation of ML algorithms has allowed pathologists to increase diagnostic accuracy with predictive analytics as these algorithms examine huge amounts of data to pick up patterns that are missed by the human eye, thus allowing earlier and more accurate detection of cancer. This shift to automated systems has lowered diagnosis time significantly, enhancing the efficiency of workflows in clinical environments.

The volume of M&A deals is moderate in the market. The mature players are taking over the emerging players to enhance their position. In March 2023, for example, Clarapath bought Crosscope, a digital pathology firm that focuses on artificial intelligence software. Clarapath, which boasts of its fully automated SectionStar tissue sectioning system, plans to bring these technologies together with Crosscope's computational pathology tools to design an end-to-end platform that improves patient-centric care in human as well as animal health.

Growing government backing in the way of approvals is stimulating firms to invest in technology developments and expansion initiatives. For example, Paige obtained the FDA de novo marketing authorization for its artificial intelligence-driven diagnostic software, Paige Prostate, for the detection of prostate cancer in September 2021. This path-breaking approval makes Paige Prostate eligible to be employed as an in vitro diagnostic device through the FullFocus digital pathology viewer.

Geographical expansion fuels the growth by increasing access to sophisticated solutions across different geographical areas worldwide. For example, in April 2022, Crosscope Inc. collaborated with Waleed Pharmacy & Stores LLC to bring AI-powered digital pathology solutions to Oman. The partnership is intended to improve cancer diagnostics and care due to the increasing incidence of cancer in the region. Waleed Pharmacy will act as Crosscope's representative in Oman, using its experience to promote healthcare IT solutions.

Component Insights

Software segment led the market and recorded the highest market share of 66.5% in 2024 due to its favorable effect on clinical workflows and diagnostic processes. Software solutions powered by AI have greatly improved the efficiency of pathologists by eliminating the time-consuming procedures like image analysis, data extraction, and report generation. In addition, software development that makes the adoption of computation pathology easier is also fueling the growth of the segment. Aiosyn in March 2023 rolled out AiosynQC, an AI-driven automated quality control product for accelerating digital pathology workflows in pharmaceuticals, research, and diagnostics. It is the first of a series of workflow solutions offered by Aiosyn, with the mission to make integrating computational pathology algorithms into routine practices easy, thus improving diagnostic accuracy and quality.

Services segment is anticipated to experience the highest growth during the forecast period due to the growing need for remote services and telepathology solutions. Computational pathology tasks are being outsourced as a trend fueled by the demand for cost-efficient and scalable solutions. With healthcare institutions experiencing issues like a lack of trained pathologists, they are resorting to service providers that provide specialized expertise and cutting-edge technologies, thus driving the segment growth.

Application Insights

Disease diagnosis segment led the market in terms of revenue share of 45.7% in 2024 due to growing demand for precise and effective diagnostic solutions in clinical application. As healthcare systems battle the issue of oncoming prevalence chronic conditions, there is growing demand for sophisticated diagnostic solutions that enable improved patient care. Firms are increasingly making investments in sophisticated solutions to enhance the treatment and diagnostics of chronic diseases. For example, in May 2024, Microsoft partnered with the University of Washington, and the Providence health network to overcome significant barriers to the broad adoption of artificial intelligence in cancer diagnostics by launching an ambitious digital pathology initiative. It looks to create a machine learning model that has been trained on one of the largest collections of real-world, whole-slide tissue images to improve diagnostic accuracy and scalability in clinical practice. With more hospitals and labs embracing digital pathology solutions, the disease diagnosis segment is likely to see high growth during the forecast period.

Academic research segment is likely to experience the most rapid growth due to the growing focus on precision medicine and personalized healthcare, fueling the need for sophisticated analytical methods to decipher intricate biological data. Academic research institutions are spearheading innovation with research programs that take advantage of computational pathology platforms to process big datasets.

Technology Insights

Machine learning generated the highest revenue share in 2024 because these technologies assist in increasing diagnostic accuracy and efficiency through more complex data analysis. As an example, Bayer and Aignostics partnered in March 2024 to drive precision oncology by building next-generation diagnostics solutions. In addition, the collaboration will concentrate on developing artificial intelligence (AI) and machine learning (ML)-driven computational pathology algorithms. These algorithms will connect baseline pathology information, such as molecular tumor profiles, with clinical data like patient outcomes. This combination will help improve patient identification, stratification, and selection for clinical trials. Such strategic initiatives towards the creation of ML-based solutions are also helping drive segment growth.

Natural Language Processing (NLP) models segment is anticipated to grow the fastest because they can improve the accuracy of diagnoses and make work processes more efficient. With the inclusion of NLP, unstructured medical information such as pathology reports can be analyzed efficiently. This allows pathologists to obtain useful information from huge databases and make faster and more accurate diagnoses. 

End-use Insights

Hospitals and diagnostic laboratories accounted for the highest revenue share in 2024. This is due to the growing uptake of digital pathology in such establishments to improve diagnostic output and workflow efficiency, which is critical in the management of the growing incidence of chronic diseases like cancer. For example, in March 2025, Paris Saint-Joseph Hospital and Marie Lannelongue Hospital joined hands with Koninklijke Philips N.V. to embrace digital pathology as a component of their overall enterprise imaging strategy. Its integration is geared towards giving health professionals uninterrupted access to diagnostic intelligence across anatomical, cellular, and molecular information. Furthermore, the growing utilization of telepathology enables such institutions to project their reach past geographical boundaries, rendering expert analyses accessible even in remote locations.

Pharmaceutical and biotechnology firms are anticipated to experience the highest growth during the forecast period. These firms are utilizing sophisticated computational methods to optimize drug discovery and development processes. By incorporating AI and ML algorithms into processes, they can process large volumes of data more effectively, resulting in quicker identification of biomarkers and therapeutic targets. Moreover, increasing demand for personalized medicine requires accurate diagnostic tools to provide personalized treatment plans according to individual patient requirements.

Market Analysis

Download Sample  Ask for Discount  Request Customization 

Regional Insights

North America led the computational pathology market and held the highest revenue share of 40.5% in 2024. This is due to the well-developed healthcare infrastructure, adoption of advanced technologies, and availability of various market players, which enhances the availability of computational pathology solutions. The well-developed healthcare infrastructure of the region provides growth opportunities for the companies, thus enhancing their interest in region's healthcare sector.

For example, in February 2023, Clarapath acquired Crosscope to combine tissue robotics processing with digital pathology driven by AI, to transform lab operations. This merger brings together Clarapath's SectionStar, a completely automated tissue sectioning system, and Crosscope's computational pathology tools and advanced workflow. The union aims to resolve essential issues in labs, including labor shortages and rising sample volumes, through efficiency and quality of care improvements.

U.S. Computational Pathology Market Trends

Computational pathology market in the U.S. had the highest share in 2024. One of the primary drivers of the market growth is the high rate of adoption of these solutions within the country due to their broad spectrum of applications, ranging from disease diagnosis to research purposes in academia. In addition, the growing efforts and investments in research to further boost the use of computational pathology are further propelling the market growth. For example, in April of 2024, the University of Pittsburgh and UPMC opened the computational pathology and AI Center of Excellence (CPACE) at the UPMC Cancer Pavilion, with the goal of bringing together professionals who specialize in these solutions and artificial intelligence to ensure collaboration and innovation in medical science. CPACE is centered on the use of AI for enhanced disease identification and personalized treatment recommendations, with the ultimate goal of enhanced patient care and outcomes.

Europe Computational Pathology Market Trends

The market for computational pathology in Europe is growing due to the increasing use of AI-enabled diagnostic solutions, digitization of healthcare, and emphasis on precision medicine. For example, the European Union's funding of AI research via efforts such as the Horizon 2020 program drives technological advancements in computational pathology. Furthermore, the need for effective, scalable diagnostic algorithms, particularly in the post-COVID-19 era, has further driven the growth of the market throughout Europe.

Asia Pacific Computational Pathology Market Trends

Asia Pacific computational pathology market is anticipated to have the highest growth rate during the forecast period. The market in the Asia Pacific region has witnessed an increased incidence of diseases like cancer, cardiovascular diseases, and neurological conditions. As per the Global Cancer Observatory (GLOBOCAN 2022), an estimated 9,826,539 individuals were diagnosed with cancer in 2022, with lung, breast, and colorectum cancer being the most common types of cancer. This has resulted in increasing demand for effective diagnostic solutions and heightened use of these solutions for disease detection, grading, and research. Furthermore, the rising investments and rising consciousness regarding the benefits of technologically superior solutions are also helping drive the market. 

China's computational pathology market is spurred on by the rise in investment into healthcare infrastructure that has created cutting-edge laboratories and research facilities integrated with digital pathology technologies. The researchers are investing further in research to create innovative solutions. For example, in April 2025, researchers at the Chinese University of Hong Kong presented a novel paradigm, MAGA-GLTrans, to tackle the efficiency issues of digital pathology due to dependency on high-magnification whole-slide imaging. It takes low-magnification images and a self-supervised magnification alignment process to cut down computation time (up to 10.7x) and storage/transfer requirements (more than 20x) without any degradation in diagnostic accuracy. This development increases the clinical value of computational pathology, particularly in time-critical settings such as intraoperative diagnosis.

India computational pathology market is likely to see high growth during the forecast period due to the growing development in diagnostic equipment that can improve accuracy and efficiency in pathology. Based on the Indian Council of Medical Research (ICMR) report, approximately 1,461,427 individuals were diagnosed with cancer in India during 2022, with an incident rate of approximately 100.4 per 100,000 population. Additionally, growing awareness regarding benefits of such solutions is further driving the market growth.

Latin America Computational Pathology Market Trends

Latin America computational pathology market is fueled by the need for innovative diagnostic instruments, most notably in oncology. Furthermore, technological advancements and government encouragement are hastening AI and machine learning integration in pathology to improve treatment accuracy and efficiency.

Middle East & Africa Computational Pathology Market Trends

MEA computational pathology market is fueled by rising healthcare digitization, increasing AI-based diagnostic tool adoption, and increasing healthcare infrastructure growth. Government efforts to upgrade healthcare systems, along with increasing recognition of precision medicine, are compelling demand for sophisticated pathology solutions. Besides, the cancer diagnosis and treatment focus of the region is further propelling the use of computational pathology technologies, furthering market growth.

Key Computational Pathology Company Insights

Key companies are adopting strategies such as mergers and acquisitions, product and service launches, agreements, joint ventures, collaborations, and expansion to strengthen their position in the market.

Key Computational Pathology Companies

The following are the leading companies in the computational pathology market. These companies collectively hold the largest market share and dictate industry trends

Recent Developments

  • In May 2024, Microsoft collaborated with the University of Washington, and Providence Health aims to address key challenges in implementing AI for cancer diagnostics, leveraging significant scale. The researchers have developed a machine learning model, which Providence describes as one of the most extensive AI training initiatives in real-world whole-slide tissue analysis.

“This transformative work is the result of focused efforts to overcome three major challenges that have stymied previous computational pathology models from widely being applied in the clinical settingshortage of real-world data, inability to incorporate whole-slide modeling and lack of accessibility,”

-Providence’s chief analytics and research officer 

  • In July 2024, Proscia launched an updated version of Concentriq AP. This new release enhances AI's role in advancing pathologists' insights into four of the top five most common cancers globally. Concentriq AP, a cloud-based workflow solution, is designed to deliver significant confidence and efficiency improvements for large global laboratory networks.

“We built the new version of Concentriq AP working closely with our growing customer base to realize our vision for pathology’s precision medicine future. It gives them the features they need to scale their use of AI-enabled pathology and capitalize on the latest innovations that shape our understanding of disease.”

-Proscia’s Senior Vice President of Product

  • In May 2021, Quest Diagnostics partnered with Paige.ai for developing AI-driven digital pathology cancer diagnostics. Paige's computational platform uses machine learning to extract diagnostic information from pathology slides, helping pathologists analyze images more quickly and accurately. The collaboration focuses on developing software for diagnosing solid tumors in lung cancer, prostate, and colorectal breast patients and aims to deliver insights to improve cancer diagnosis and make precision medicine more accessible and actionable.

“As the leader in advanced diagnostics, we are excited to actively participate in the creation and use of new technologies that further the mission to make precision medicine clinically accessible, actionable and economical. We are energized about contributing our expertise to Paige’s computational pathology leadership to deliver insights from leading-edge technologies to improve the diagnosis of cancer and other diseases.”

- General Manager, Oncology Franchise, Quest Diagnostics.

Computational Pathology Market Report Scope

Report Attribute

Details

Market size value in 2025

USD 700.2 million

Revenue forecast in 2030

USD 1.04 billion

Growth rate

CAGR of 8.24% from 2025 to 2030

Actual data

2018 - 2023

Forecast period

2025 - 2030

Quantitative units

Revenue in USD million/billion, and CAGR from 2025 to 2030

Report coverage

Revenue forecast, company ranking, competitive landscape, growth factors, and trends

Segments covered

Component, application, technology, end-use, region

Regional scope

North America; Europe; Asia Pacific; Latin America; MEA

Country scope

U.S.; Canada; Mexico; UK; Germany; Spain; France; Italy; Spain; Denmark; Sweden; Norway; China; Japan; India; Australia; South Korea; Thailand; Brazil; Argentina; South Africa; Saudi Arabia; UAE; Kuwait

Key companies profiled

Leica Biosystems Nussloch GmbH (Danaher); Hamamatsu Photonics K.K.; Koninklijke Philips N.V.; Olympus Corporation; F. Hoffmann-La Roche Ltd.; Mikroscan Technologies, Inc.; Epredia (3DHISTECH Ltd.); Visiopharm A/S; Proscia Inc.; Tempus; Huron Technologies International Inc.; ContextVision AB; CellaVision; aetherAI; CellCarta; IBEX (IBEX MEDICAL ANALYTICS); Nucleai, Inc.

Customization scope

Free report customization (equivalent up to 8 analysts working days) with purchase. Addition or alteration to country, regional & segment scope.

Pricing and purchase options

Avail customized purchase options to meet your exact research needs. Explore purchase options

Download Sample  Ask for Discount  Request Customization 

Global Computational Pathology Market Report Segmentation

This report forecasts revenue growth and provides at global, regional, and country levels an analysis of the latest trends in each of the sub-segments from 2018 to 2030. For this report, Grand View Research has segmented the global computational pathology market report-based on components, application, technology, end-use, and region

  • Component Outlook (Revenue, USD Million, 2018 - 2030)

    • Software

    • Services

  • Application Outlook (Revenue, USD Million, 2018 - 2030)

    • Disease Diagnosis

    • Drug Discovery & Development

    • Academic Research

  • Technology Outlook (Revenue, USD Million, 2018 - 2030)

    • Machine Learning (ML)

      • Deep Learning

      • Others

    • Natural Language Processing (NLP) Models

    • Computer Vision

    • Others

  • End-use Outlook (Revenue, USD Million, 2018 - 2030)

    • Hospitals and Diagnostic Labs

    • Biotechnology and Pharmaceutical Companies

    • Academic and Research Institutes

    • Other

  • Regional Outlook (Revenue, USD Million, 2018 - 2030)

    • North America

      • U.S.

      • Canada

      • Mexico

    • Europe

      • UK

      • Germany

      • France

      • Italy

      • Spain

      • Denmark

      • Sweden

      • Norway

    • Asia Pacific

      • Japan

      • China

      • India

      • Australia

      • South Korea

      • Thailand

    • Latin America

      • Brazil

      • Argentina

    • Middle East & Africa

      • South Africa

      • Saudi Arabia

      • UAE

      • Kuwait

Table of Content

Chapter 1. Research Methodology and Scope
                   1.1. Market Segmentation & Scope
                       1.1.1. Regional scope
                       1.1.2. Component
                       1.1.3. Technology
                       1.1.4. Application
                       1.1.5. End Use
                       1.1.6. Estimates and forecast timeline.
                   1.2. Research Methodology
                   1.3. Information Procurement
                       1.3.1. Purchased database.
                       1.3.2. GVR’s internal database
                       1.3.3. Secondary sources
                       1.3.4. Primary research
                       1.3.5. Details of primary research
                   1.4. Information or Data Analysis
                       1.4.1. Data analysis models
                   1.5. Market Formulation & Validation
                   1.6. Model Details
                       1.6.1. Commodity flow analysis (Model 1)
                       1.6.2. Approach 1: Commodity flow approach
                   1.7. List of Secondary Sources
                   1.8. List of Primary Sources
                   1.9. Objectives
Chapter 2. Executive Summary
                   2.1. Market Outlook
                   2.2. Segment Outlook
                       2.2.1. Component
                       2.2.2. Technology
                       2.2.3. Application
                       2.2.4. End Use
                       2.2.5. Regional outlook
                   2.3. Competitive Insights
Chapter 3. Computational Pathology Market Variables, Trends & Scope
                   3.1. Market Dynamics
                       3.1.1. Market driver analysis
                       3.1.2. Market restraint analysis
                       3.1.3. Market Opportunity Analysis
                   3.2. Computational Pathology Market Analysis Tools
                       3.2.1. Industry Analysis - Porter’s
                           3.2.1.1. Supplier power
                           3.2.1.2. Buyer power
                           3.2.1.3. Substitution threat
                           3.2.1.4. Threat of new entrant
                           3.2.1.5. Competitive rivalry
                       3.2.2. PESTEL Analysis
                           3.2.2.1. Political landscape
                           3.2.2.2. Economic landscape
                           3.2.2.3. Social landscape
                           3.2.2.4. Technological landscape
                           3.2.2.5. Environmental landscape
                           3.2.2.6. Legal landscape
                       3.2.3. Emerging Technology Trends
                       3.2.4. COVID-19 Impact Analysis
                       3.2.5. Case Study Analysis
Chapter 4. Computational Pathology Market: Component Estimates & Trend Analysis
                   4.1. Component Market Share, 2024 & 2030
                   4.2. Segment Dashboard
                   4.3. Global Computational Pathology Market by Component Outlook
                   4.4. Software
                       4.4.1. Market estimates and forecast 2018 to 2030 (USD Million)
                   4.5. Services
                       4.5.1. Market estimates and forecast 2018 to 2030 (USD Million)
Chapter 5. Computational Pathology Market: Application Estimates & Trend Analysis
                   5.1. Application Market Share, 2024 & 2030
                   5.2. Segment Dashboard
                   5.3. Global Computational Pathology Market by Application Outlook
                   5.4. Disease Diagnosis
                       5.4.1. Market estimates and forecast 2018 to 2030 (USD Million)
                   5.5. Drug Discovery & Development
                       5.5.1. Market estimates and forecast 2018 to 2030 (USD Million)
                   5.6. Academic Research
                       5.6.1. Market estimates and forecast 2018 to 2030 (USD Million)
Chapter 6. Computational Pathology Market: Technology Estimates & Trend Analysis
                   6.1. Technology Market Share, 2024 & 2030
                   6.2. Segment Dashboard
                   6.3. Global Computational Pathology Market by Technology Outlook
                   6.4. Machine Learning (ML)
                       6.4.1. Market estimates and forecast 2018 to 2030 (USD Million)
                       6.4.2. Deep Learning
                           6.4.2.1. Market estimates and forecast 2018 to 2030 (USD Million)
                       6.4.3. Others
                           6.4.3.1. Market estimates and forecast 2018 to 2030 (USD Million)
                   6.5. Natural Language Processing (NLP) Models
                       6.5.1. Market estimates and forecast 2018 to 2030 (USD Million)
                   6.6. Computer Vision
                       6.6.1. Market estimates and forecast 2018 to 2030 (USD Million)
                   6.7. Others
                       6.7.1. Market estimates and forecast 2018 to 2030 (USD Million)
Chapter 7. Computational Pathology Market: End Use Estimates & Trend Analysis
                   7.1. End Use Market Share, 2024 & 2030
                   7.2. Segment Dashboard
                   7.3. Global Computational Pathology Market by End Use Outlook
                   7.4. Hospitals and Diagnostic Labs
                       7.4.1. Market estimates and forecast 2018 to 2030 (USD Million)
                   7.5. Biotechnology and Pharmaceutical Companies
                       7.5.1. Market estimates and forecast 2018 to 2030 (USD Million)
                   7.6. Academic and Research Institutes
                       7.6.1. Market estimates and forecast 2018 to 2030 (USD Million)
                   7.7. Others
                       7.7.1. Market estimates and forecast 2018 to 2030 (USD Million)
Chapter 8. Computational Pathology Market: Regional Estimates & Trend Analysis, By Component, By Application, By Technology, By End Use
                   8.1. Regional Market Share Analysis, 2024 & 2030
                   8.2. Regional Market Dashboard
                   8.3. Global Regional Market Snapshot
                   8.4. Market Size & Forecasts Trend Analysis, 2018 to 2030:
                   8.5. North America
                       8.5.1. U.S.
                           8.5.1.1. Key country dynamics
                           8.5.1.2. Regulatory framework
                           8.5.1.3. Competitive scenario
                           8.5.1.4. U.S. market estimates and forecasts 2018 to 2030 (USD Million)
                       8.5.2. Canada
                           8.5.2.1. Key country dynamics
                           8.5.2.2. Regulatory framework
                           8.5.2.3. Competitive scenario
                           8.5.2.4. Canada market estimates and forecasts 2018 to 2030 (USD Million)
                       8.5.3. Mexico
                           8.5.3.1. Key country dynamics
                           8.5.3.2. Regulatory framework
                           8.5.3.3. Competitive scenario
                           8.5.3.4. Canada market estimates and forecasts 2018 to 2030 (USD Million)
                   8.6. Europe
                       8.6.1. UK
                           8.6.1.1. Key country dynamics
                           8.6.1.2. Regulatory framework
                           8.6.1.3. Competitive scenario
                           8.6.1.4. UK market estimates and forecasts 2018 to 2030 (USD Million)
                       8.6.2. Germany
                           8.6.2.1. Key country dynamics
                           8.6.2.2. Regulatory framework
                           8.6.2.3. Competitive scenario
                           8.6.2.4. Germany market estimates and forecasts 2018 to 2030 (USD Million)
                       8.6.3. France
                           8.6.3.1. Key country dynamics
                           8.6.3.2. Regulatory framework
                           8.6.3.3. Competitive scenario
                           8.6.3.4. France market estimates and forecasts 2018 to 2030 (USD Million)
                       8.6.4. Italy
                           8.6.4.1. Key country dynamics
                           8.6.4.2. Regulatory framework
                           8.6.4.3. Competitive scenario
                           8.6.4.4. Italy market estimates and forecasts 2018 to 2030 (USD Million)
                       8.6.5. Spain
                           8.6.5.1. Key country dynamics
                           8.6.5.2. Regulatory framework
                           8.6.5.3. Competitive scenario
                           8.6.5.4. Spain market estimates and forecasts 2018 to 2030 (USD Million)
                       8.6.6. Norway
                           8.6.6.1. Key country dynamics
                           8.6.6.2. Regulatory framework
                           8.6.6.3. Competitive scenario
                           8.6.6.4. Norway market estimates and forecasts 2018 to 2030 (USD Million)
                       8.6.7. Sweden
                           8.6.7.1. Key country dynamics
                           8.6.7.2. Regulatory framework
                           8.6.7.3. Competitive scenario
                           8.6.7.4. Sweden market estimates and forecasts 2018 to 2030 (USD Million)
                       8.6.8. Denmark
                           8.6.8.1. Key country dynamics
                           8.6.8.2. Regulatory framework
                           8.6.8.3. Competitive scenario
                           8.6.8.4. Denmark market estimates and forecasts 2018 to 2030 (USD Million)
                   8.7. Asia Pacific
                       8.7.1. Japan
                           8.7.1.1. Key country dynamics
                           8.7.1.2. Regulatory framework
                           8.7.1.3. Competitive scenario
                           8.7.1.4. Japan market estimates and forecasts 2018 to 2030 (USD Million)
                       8.7.2. China
                           8.7.2.1. Key country dynamics
                           8.7.2.2. Regulatory framework
                           8.7.2.3. Competitive scenario
                           8.7.2.4. China market estimates and forecasts 2018 to 2030 (USD Million)
                       8.7.3. India
                           8.7.3.1. Key country dynamics
                           8.7.3.2. Regulatory framework
                           8.7.3.3. Competitive scenario
                           8.7.3.4. India market estimates and forecasts 2018 to 2030 (USD Million)
                       8.7.4. Australia
                           8.7.4.1. Key country dynamics
                           8.7.4.2. Regulatory framework
                           8.7.4.3. Competitive scenario
                           8.7.4.4. Australia market estimates and forecasts 2018 to 2030 (USD Million)
                       8.7.5. South Korea
                           8.7.5.1. Key country dynamics
                           8.7.5.2. Regulatory framework
                           8.7.5.3. Competitive scenario
                           8.7.5.4. South Korea market estimates and forecasts 2018 to 2030 (USD Million)
                       8.7.6. Thailand
                           8.7.6.1. Key country dynamics
                           8.7.6.2. Regulatory framework
                           8.7.6.3. Competitive scenario
                           8.7.6.4. Singapore market estimates and forecasts 2018 to 2030 (USD Million)
                   8.8. Latin America
                       8.8.1. Brazil
                           8.8.1.1. Key country dynamics
                           8.8.1.2. Regulatory framework
                           8.8.1.3. Competitive scenario
                           8.8.1.4. Brazil market estimates and forecasts 2018 to 2030 (USD Million)
                       8.8.2. Argentina
                           8.8.2.1. Key country dynamics
                           8.8.2.2. Regulatory framework
                           8.8.2.3. Competitive scenario
                           8.8.2.4. Argentina market estimates and forecasts 2018 to 2030 (USD Million)
                   8.9. MEA
                       8.9.1. South Africa
                           8.9.1.1. Key country dynamics
                           8.9.1.2. Regulatory framework
                           8.9.1.3. Competitive scenario
                           8.9.1.4. South Africa market estimates and forecasts 2018 to 2030 (USD Million)
                       8.9.2. Saudi Arabia
                           8.9.2.1. Key country dynamics
                           8.9.2.2. Regulatory framework
                           8.9.2.3. Competitive scenario
                           8.9.2.4. Saudi Arabia market estimates and forecasts 2018 to 2030 (USD Million)
                       8.9.3. UAE
                           8.9.3.1. Key country dynamics
                           8.9.3.2. Regulatory framework
                           8.9.3.3. Competitive scenario
                           8.9.3.4. UAE market estimates and forecasts 2018 to 2030 (USD Million)
                       8.9.4. Kuwait
                           8.9.4.1. Key country dynamics
                           8.9.4.2. Regulatory framework
                           8.9.4.3. Competitive scenario
                           8.9.4.4. Kuwait market estimates and forecasts 2018 to 2030 (USD Million)
Chapter 9. Competitive Landscape
                   9.1. Recent Developments & Impact Analysis, By Key Market Participants
                   9.2. Company/Competition Categorization
                   9.3. Key company market share/position analysis, 2024
                   9.4. Company Profiles
                       9.4.1. Leica Biosystems Nussloch GmbH (Danaher)
                           9.4.1.1. Company overview
                           9.4.1.2. Financial performance
                           9.4.1.3. Product benchmarking
                           9.4.1.4. Strategic initiatives
                       9.4.2. Hamamatsu Photonics K.K.
                           9.4.2.1. Company overview
                           9.4.2.2. Financial performance
                           9.4.2.3. Product benchmarking
                           9.4.2.4. Strategic initiatives
                       9.4.3. Koninklijke Philips N.V.
                           9.4.3.1. Company overview
                           9.4.3.2. Financial performance
                           9.4.3.3. Product benchmarking
                           9.4.3.4. Strategic initiatives
                       9.4.4. Olympus Corporation
                           9.4.4.1. Company overview
                           9.4.4.2. Financial performance
                           9.4.4.3. Product benchmarking
                           9.4.4.4. Strategic initiatives
                       9.4.5. F. Hoffmann-La Roche Ltd.
                           9.4.5.1. Company overview
                           9.4.5.2. Financial performance
                           9.4.5.3. Product benchmarking
                           9.4.5.4. Strategic initiatives
                       9.4.6. Mikroscan Technologies, Inc.
                           9.4.6.1. Company overview
                           9.4.6.2. Financial performance
                           9.4.6.3. Product benchmarking
                           9.4.6.4. Strategic initiatives
                       9.4.7. Epredia (3DHISTECH Ltd.)
                           9.4.7.1. Company overview
                           9.4.7.2. Financial performance
                           9.4.7.3. Product benchmarking
                           9.4.7.4. Strategic initiatives
                       9.4.8. Visiopharm A/S
                           9.4.8.1. Company overview
                           9.4.8.2. Financial performance
                           9.4.8.3. Product benchmarking
                           9.4.8.4. Strategic initiatives
                       9.4.9. Proscia Inc.
                           9.4.9.1. Company overview
                           9.4.9.2. Financial performance
                           9.4.9.3. Product benchmarking
                           9.4.9.4. Strategic initiatives
                       9.4.10. Tempus
                           9.4.10.1. Company overview
                           9.4.10.2. Financial performance
                           9.4.10.3. Product benchmarking
                           9.4.10.4. Strategic initiatives
                       9.4.11. Huron Technologies International Inc.
                           9.4.11.1. Company overview
                           9.4.11.2. Financial performance
                           9.4.11.3. Product benchmarking
                           9.4.11.4. Strategic initiatives
                       9.4.12. ContextVision AB
                           9.4.12.1. Company overview
                           9.4.12.2. Financial performance
                           9.4.12.3. Product benchmarking
                           9.4.12.4. Strategic initiatives
                       9.4.13. CellaVision
                           9.4.13.1. Company overview
                           9.4.13.2. Financial performance
                           9.4.13.3. Product benchmarking
                           9.4.13.4. Strategic initiatives
                       9.4.14. aetherAI
                           9.4.14.1. Company overview
                           9.4.14.2. Financial performance
                           9.4.14.3. Product benchmarking
                           9.4.14.4. Strategic initiatives
                       9.4.15. CellCarta
                           9.4.15.1. Company overview
                           9.4.15.2. Financial performance
                           9.4.15.3. Product benchmarking
                           9.4.15.4. Strategic initiatives
                       9.4.16. IBEX (IBEX MEDICAL ANALYTICS)
                           9.4.16.1. Company overview
                           9.4.16.2. Financial performance
                           9.4.16.3. Product benchmarking
                           9.4.16.4. Strategic initiatives
                       9.4.17. Nucleai, Inc.
                           9.4.17.1. Company overview
                           9.4.17.2. Financial performance
                           9.4.17.3. Product benchmarking
                           9.4.17.4. Strategic initiatives


List Tables Figures

List of Tables

Table 1 List of abbreviation
Table 2 North America Computational Pathology Market, By Region, 2018 - 2030 (USD Million)
Table 3 North America Computational Pathology Market By Component, 2018 - 2030 (USD Million)
Table 4 North America Computational Pathology Market By Technology, 2018 - 2030 (USD Million)
Table 5 North America Computational Pathology Market By Application, 2018 - 2030 (USD Million)
Table 6 North America Computational Pathology Market By End use, 2018 - 2030 (USD Million)
Table 7 U.S. Computational Pathology Market By Component, 2018 - 2030 (USD Million)
Table 8 U.S. Computational Pathology Market By Technology, 2018 - 2030 (USD Million)
Table 9 U.S. Computational Pathology Market By Application, 2018 - 2030 (USD Million)
Table 10 U.S. Computational Pathology Market By End use, 2018 - 2030 (USD Million)
Table 11 Canada Computational Pathology Market By Component, 2018 - 2030 (USD Million)
Table 12 Canada Computational Pathology Market By Technology, 2018 - 2030 (USD Million)
Table 13 Canada Computational Pathology Market By Application, 2018 - 2030 (USD Million)
Table 14 Canada Computational Pathology Market By End use, 2018 - 2030 (USD Million)
Table 15 Mexico Computational Pathology Market By Component, 2018 - 2030 (USD Million)
Table 16 Mexico Computational Pathology Market By Technology, 2018 - 2030 (USD Million)
Table 17 Mexico Computational Pathology Market By Application, 2018 - 2030 (USD Million)
Table 18 Mexico Computational Pathology Market By End use, 2018 - 2030 (USD Million)
Table 19 Europe Computational Pathology Market, By Region, 2018 - 2030 (USD Million)
Table 20 Europe Computational Pathology Market, By Component, 2018 - 2030 (USD Million)
Table 21 Europe Computational Pathology Market, By Technology, 2018 - 2030 (USD Million)
Table 22 Europe Computational Pathology Market, By Application, 2018 - 2030 (USD Million)
Table 23 Europe Computational Pathology Market, By End use, 2018 - 2030 (USD Million)
Table 24 Germany Computational Pathology Market By Component, 2018 - 2030 (USD Million)
Table 25 Germany Computational Pathology Market By Technology, 2018 - 2030 (USD Million)
Table 26 Germany Computational Pathology Market By Application, 2018 - 2030 (USD Million)
Table 27 Germany Computational Pathology Market By End use, 2018 - 2030 (USD Million)
Table 28 UK Computational Pathology Market By Component, 2018 - 2030 (USD Million)
Table 29 UK Computational Pathology Market By Technology, 2018 - 2030 (USD Million)
Table 30 UK Computational Pathology Market By Application, 2018 - 2030 (USD Million)
Table 31 UK Computational Pathology Market By End use, 2018 - 2030 (USD Million)
Table 32 France Computational Pathology Market By Component, 2018 - 2030 (USD Million)
Table 33 France Computational Pathology Market By Technology, 2018 - 2030 (USD Million)
Table 34 France Computational Pathology Market By Application, 2018 - 2030 (USD Million)
Table 35 France Computational Pathology Market By End use, 2018 - 2030 (USD Million)
Table 36 Italy Computational Pathology Market By Component, 2018 - 2030 (USD Million)
Table 37 Italy Computational Pathology Market By Technology, 2018 - 2030 (USD Million)
Table 38 Italy Computational Pathology Market By Application, 2018 - 2030 (USD Million)
Table 39 Italy Computational Pathology Market By End use, 2018 - 2030 (USD Million)
Table 40 Spain Computational Pathology Market By Component, 2018 - 2030 (USD Million)
Table 41 Spain Computational Pathology Market By Technology, 2018 - 2030 (USD Million)
Table 42 Spain Computational Pathology Market By Application, 2018 - 2030 (USD Million)
Table 43 Spain Computational Pathology Market By End use, 2018 - 2030 (USD Million)
Table 44 Denmark Computational Pathology Market By Component, 2018 - 2030 (USD Million)
Table 45 Denmark Computational Pathology Market By Technology, 2018 - 2030 (USD Million)
Table 46 Denmark Computational Pathology Market By Application, 2018 - 2030 (USD Million)
Table 47 Denmark Computational Pathology Market By End use, 2018 - 2030 (USD Million)
Table 48 Sweden Computational Pathology Market By Component, 2018 - 2030 (USD Million)
Table 49 Sweden Computational Pathology Market By Technology, 2018 - 2030 (USD Million)
Table 50 Sweden Computational Pathology Market By Application, 2018 - 2030 (USD Million)
Table 51 Sweden Computational Pathology Market By End use, 2018 - 2030 (USD Million)
Table 52 Norway Computational Pathology Market By Component, 2018 - 2030 (USD Million)
Table 53 Norway Computational Pathology Market By Technology, 2018 - 2030 (USD Million)
Table 54 Norway Computational Pathology Market By Application, 2018 - 2030 (USD Million)
Table 55 Norway Computational Pathology Market By End use, 2018 - 2030 (USD Million)
Table 56 Asia Pacific Computational Pathology Market, by region, 2018 - 2030 (USD Million)
Table 57 Asia Pacific Computational Pathology Market By Component, 2018 - 2030 (USD Million)
Table 58 Asia Pacific Computational Pathology Market By Technology, 2018 - 2030 (USD Million)
Table 59 Asia Pacific Computational Pathology Market By Application, 2018 - 2030 (USD Million)
Table 60 Asia Pacific Computational Pathology Market By End use, 2018 - 2030 (USD Million)
Table 61 China Computational Pathology Market By Component, 2018 - 2030 (USD Million)
Table 62 China Computational Pathology Market By Technology, 2018 - 2030 (USD Million)
Table 63 China Computational Pathology Market By Application, 2018 - 2030 (USD Million)
Table 64 China Computational Pathology Market By End use, 2018 - 2030 (USD Million)
Table 65 Japan Computational Pathology Market By Component, 2018 - 2030 (USD Million)
Table 66 Japan Computational Pathology Market By Technology, 2018 - 2030 (USD Million)
Table 67 Japan Computational Pathology Market By Application, 2018 - 2030 (USD Million)
Table 68 Japan Computational Pathology Market By End use, 2018 - 2030 (USD Million)
Table 69 India Computational Pathology Market By Component, 2018 - 2030 (USD Million)
Table 70 India Computational Pathology Market By Technology, 2018 - 2030 (USD Million)
Table 71 India Computational Pathology Market By Application, 2018 - 2030 (USD Million)
Table 72 India Computational Pathology Market By End use, 2018 - 2030 (USD Million)
Table 73 South Korea Computational Pathology Market By Component, 2018 - 2030 (USD Million)
Table 74 South Korea Computational Pathology Market By Technology, 2018 - 2030 (USD Million)
Table 75 South Korea Computational Pathology Market By Application, 2018 - 2030 (USD Million)
Table 76 South Korea Computational Pathology Market By End use, 2018 - 2030 (USD Million)
Table 77 Australia Computational Pathology Market By Component, 2018 - 2030 (USD Million)
Table 78 Australia Computational Pathology Market By Technology, 2018 - 2030 (USD Million)
Table 79 Australia Computational Pathology Market By Application, 2018 - 2030 (USD Million)
Table 80 Australia Computational Pathology Market By End use, 2018 - 2030 (USD Million)
Table 81 Thailand Computational Pathology Market By Component, 2018 - 2030 (USD Million)
Table 82 Thailand Computational Pathology Market By Technology, 2018 - 2030 (USD Million)
Table 83 Thailand Computational Pathology Market By Application, 2018 - 2030 (USD Million)
Table 84 Thailand Computational Pathology Market By End use, 2018 - 2030 (USD Million)
Table 85 Latin America Computational Pathology Market, by region, 2018 - 2030 (USD Million)
Table 86 Latin America Computational Pathology Market By Component, 2018 - 2030 (USD Million)
Table 87 Latin America Computational Pathology Market By Technology, 2018 - 2030 (USD Million)
Table 88 Latin America Computational Pathology Market By Application, 2018 - 2030 (USD Million)
Table 89 Latin America Computational Pathology Market By End use, 2018 - 2030 (USD Million)
Table 90 Brazil Computational Pathology Market By Component, 2018 - 2030 (USD Million)
Table 91 Brazil Computational Pathology Market By Technology, 2018 - 2030 (USD Million)
Table 92 Brazil Computational Pathology Market By Application, 2018 - 2030 (USD Million)
Table 93 Brazil Computational Pathology Market By End use, 2018 - 2030 (USD Million)
Table 94 Argentina Computational Pathology Market By Component, 2018 - 2030 (USD Million)
Table 95 Argentina Computational Pathology Market By Technology, 2018 - 2030 (USD Million)
Table 96 Argentina Computational Pathology Market By Application, 2018 - 2030 (USD Million)
Table 97 Argentina Computational Pathology Market By End use, 2018 - 2030 (USD Million)
Table 98 MEA Computational Pathology Market, by region, 2018 - 2030 (USD Million)
Table 99 MEA Computational Pathology Market By Component, 2018 - 2030 (USD Million)
Table 100 MEA Computational Pathology Market By Technology, 2018 - 2030 (USD Million)
Table 101 MEA Computational Pathology Market By Application, 2018 - 2030 (USD Million)
Table 102 MEA Computational Pathology Market By End use, 2018 - 2030 (USD Million)
Table 103 South Africa Computational Pathology Market By Component, 2018 - 2030 (USD Million)
Table 104 South Africa Computational Pathology Market By Technology, 2018 - 2030 (USD Million)
Table 105 South Africa Computational Pathology Market By Application, 2018 - 2030 (USD Million)
Table 106 South Africa Computational Pathology Market By End use, 2018 - 2030 (USD Million)
Table 107 Saudi Arabia Computational Pathology Market By Component, 2018 - 2030 (USD Million)
Table 108 Saudi Arabia Computational Pathology Market By Technology, 2018 - 2030 (USD Million)
Table 109 Saudi Arabia Computational Pathology Market By Application, 2018 - 2030 (USD Million)
Table 110 Saudi Arabia Computational Pathology Market By End use, 2018 - 2030 (USD Million)
Table 111 UAE Computational Pathology Market By Component, 2018 - 2030 (USD Million)
Table 112 UAE Computational Pathology Market By Technology, 2018 - 2030 (USD Million)
Table 113 UAE Computational Pathology Market By Application, 2018 - 2030 (USD Million)
Table 114 UAE Computational Pathology Market By End use, 2018 - 2030 (USD Million)
Table 115 Kuwait Computational Pathology Market, 2018 - 2030 (USD Million)
Table 116 Kuwait Computational Pathology Market By Component, 2018 - 2030 (USD Million)
Table 117 Kuwait Computational Pathology Market By Technology, 2018 - 2030 (USD Million)
Table 118 Kuwait Computational Pathology Market By Application, 2018 - 2030 (USD Million)
Table 119 Kuwait Computational Pathology Market By End use, 2018 - 2030 (USD Million)


List of Figures

Fig. 1 Market research process
Fig. 2 Data triangulation techniques
Fig. 3 Primary research pattern
Fig. 4 Market research approaches
Fig. 5 Value-chain-based sizing & forecasting
Fig. 6 QFD modeling for market share assessment
Fig. 7 Market formulation & validation
Fig. 8 Computational Pathology Market outlook
Fig. 9 Computational Pathology competitive insights
Fig. 10 Parent market outlook
Fig. 11 Related/ancillary market outlook
Fig. 12 Penetration and growth prospect mapping
Fig. 13 Industry value chain analysis
Fig. 14 Computational Pathology Market driver impact
Fig. 15 Computational Pathology Market restraint impact
Fig. 16 Computational Pathology Market strategic initiatives analysis
Fig. 17 Computational Pathology Market: Component movement analysis
Fig. 18 Computational Pathology Market: Component outlook and key takeaways
Fig. 19 Software market estimates and forecast, 2018 - 2030
Fig. 20 Services market estimates and forecast, 2018 - 2030
Fig. 21 Computational Pathology Market: Application movement analysis
Fig. 22 Computational Pathology Market: Application outlook and key takeaways
Fig. 23 Disease diagnosis market estimates and forecast, 2018 - 2030
Fig. 24 Drug discovery & development market estimates and forecast, 2018 - 2030
Fig. 25 Academic research market estimates and forecast, 2018 - 2030
Fig. 26 Computational Pathology Market: Technology movement analysis
Fig. 27 Computational Pathology Market: Technology outlook and key takeaways
Fig. 28 Machine Learning (ML) market estimates and forecast, 2018 - 2030
Fig. 29 Deep Learning market estimates and forecast, 2018 - 2030
Fig. 30 Others market estimates and forecast, 2018 - 2030
Fig. 31 Natural Language Processing (NLP) models market estimates and forecast, 2018 - 2030
Fig. 32 Computer vision market estimates and forecast, 2018 - 2030
Fig. 33 Others market estimates and forecast, 2018 - 2030
Fig. 34 Computational Pathology Market: End use movement analysis
Fig. 35 Computational Pathology Market: End use outlook and key takeaways
Fig. 36 Hospitals and Diagnostic Labs market estimates and forecast, 2018 - 2030
Fig. 37 Biotechnology and Pharmaceutical Companies market estimates and forecast, 2018 - 2030
Fig. 38 Academic and Research Institutes market estimates and forecast, 2018 - 2030
Fig. 39 Other market estimates and forecast, 2018 - 2030
Fig. 40 Global Computational Pathology Market: Regional movement analysis
Fig. 41 Global Computational Pathology Market: Regional outlook and key takeaways
Fig. 42 Global Computational Pathology Market share and leading players
Fig. 43 North America market share and leading players
Fig. 44 Europe market share and leading players
Fig. 45 Asia Pacific market share and leading players
Fig. 46 Latin America market share and leading players
Fig. 47 Middle East & Africa market share and leading players
Fig. 48 North America market estimates and forecasts, 2018 - 2030
Fig. 49 U.S. market estimates and forecasts, 2018 - 2030
Fig. 50 Canada market estimates and forecasts, 2018 - 2030
Fig. 51 Mexico market estimates and forecasts, 2018 - 2030
Fig. 52 Europe market estimates and forecasts, 2018 - 2030
Fig. 53 UK market estimates and forecasts, 2018 - 2030
Fig. 54 Germany market estimates and forecasts, 2018 - 2030
Fig. 55 France market estimates and forecasts, 2018 - 2030
Fig. 56 Italy market estimates and forecasts, 2018 - 2030
Fig. 57 Spain market estimates and forecasts, 2018 - 2030
Fig. 58 Denmark market estimates and forecasts, 2018 - 2030
Fig. 59 Sweden market estimates and forecasts, 2018 - 2030
Fig. 60 Norway market estimates and forecasts, 2018 - 2030
Fig. 61 Asia Pacific market estimates and forecasts, 2018 - 2030
Fig. 62 China market estimates and forecasts, 2018 - 2030
Fig. 63 Japan market estimates and forecasts, 2018 - 2030
Fig. 64 India market estimates and forecasts, 2018 - 2030
Fig. 65 Thailand market estimates and forecasts, 2018 - 2030
Fig. 66 South Korea market estimates and forecasts, 2018 - 2030
Fig. 67 Australia market estimates and forecasts, 2018 - 2030
Fig. 68 Latin America market estimates and forecasts, 2018 - 2030
Fig. 69 Brazil market estimates and forecasts, 2018 - 2030
Fig. 70 Argentina market estimates and forecasts, 2018 - 2030
Fig. 71 Middle East and Africa market estimates and forecasts, 2018 - 2030
Fig. 72 South Africa market estimates and forecasts, 2018 - 2030
Fig. 73 Saudi Arabia market estimates and forecasts, 2018 - 2030
Fig. 74 UAE market estimates and forecasts, 2018 - 2030
Fig. 75 Kuwait market estimates and forecasts, 2018 - 2030
Fig. 76 Market share of key market players- Computational Pathology Market
Fig. 77 Key Company Categorization
Fig. 78 Company Market Share/Position Analysis, 2024
Fig. 79 Strategic Framework

FAQ'S

For a single, multi and corporate client license, the report will be available in PDF format. Sample report would be given you in excel format. For more questions please contact:

sales@marketinsightsresearch.com

Within 24 to 48 hrs.

You can contact Sales team (sales@marketinsightsresearch.com) and they will direct you on email

You can order a report by selecting payment methods, which is bank wire or online payment through any Debit/Credit card, Razor pay or PayPal.